> ## Documentation Index
> Fetch the complete documentation index at: https://docs.threataware.com/llms.txt
> Use this file to discover all available pages before exploring further.
# Device Management
> The unified device inventory — every device from every connected source, deduplicated, filterable, exportable
## Overview
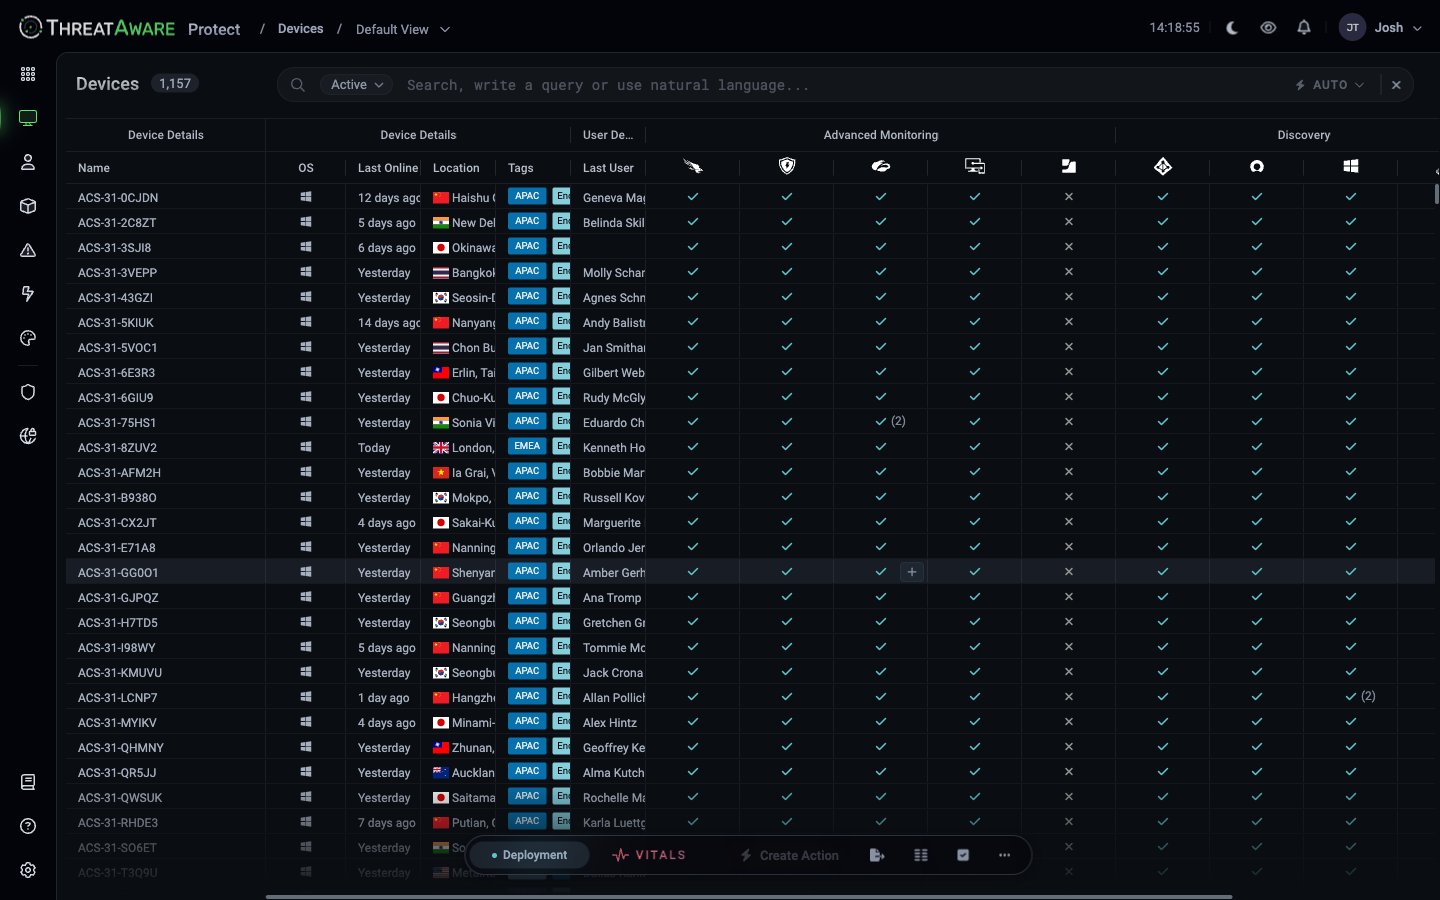
The **Devices** page at `/devices` is the workhorse of Protect. It's a single inventory of every device across your environment, fused from every connected source. Where [Device Explorer](/device-explorer) shows the world map, Devices is the data grid.
 ## Column architecture
Columns are organised into five groups:
| Group | What's in it |
| ----------------------- | ----------------------------------------------------------------- |
| **Device Details** | `Name`, `OS`, `Last Online`, `Location`, `Tags` |
| **User Details** | `Last User` |
| **Advanced Monitoring** | One column per EDR / MDM / vulnerability / monitoring integration |
| **Discovery** | One column per directory / identity / inventory integration |
| **Network Scanning** | One column per network discovery tool |
In **Deployment view** each integration column is a check / no-check ("does this device exist in this tool?"). In **Vitals view** the same column shows Healthy / Functioning / Misconfigured / Not Healthy. Toggle in the bottom-left of the page footer.
## Default vs custom columns
The default column set is intentionally minimal — Name, OS, Last Online, Location, Tags, Last User, plus the integration columns. Hundreds of additional fields are available via the **column editor** (grid icon, bottom-right of the page):
`metadata.serial_number`, `metadata.manufacturer`, `metadata.model`, `metadata.cpu_model`, `metadata.cpu_cores`, `metadata.cpu_speed`, `metadata.total_ram`, `metadata.total_storage`, `metadata.free_storage`, `metadata.architecture`, `metadata.disk_type`, `metadata.video_card`, `metadata.warranty_expiry`
`privateIp`, `publicIp`, `macAddress`, `metadata.domain`, `location.country`, `location.city`, `location.countryCode`, `location.coordinates`
`lastUser.email`, `lastUser.name`, `lastUser.department`, `lastUser.jobTitle`
`os` (enum: Windows / MacOs / Linux), `osVersion`, `metadata.os_build`, `lastLogin`, `lastOnline`
`system..required`, `system..deployed`, `system..functioning`, `system..configuredCorrectly` (booleans, one set per connected integration — see [Reference → Vitals states](/reference/vitals-states))
Click any column header's gear to **sort**, **filter directly on that column**, or **enter Configure Mode** (for Vital columns — see [Vitals Configuration](/vitals-configuration)).
## The device detail panel
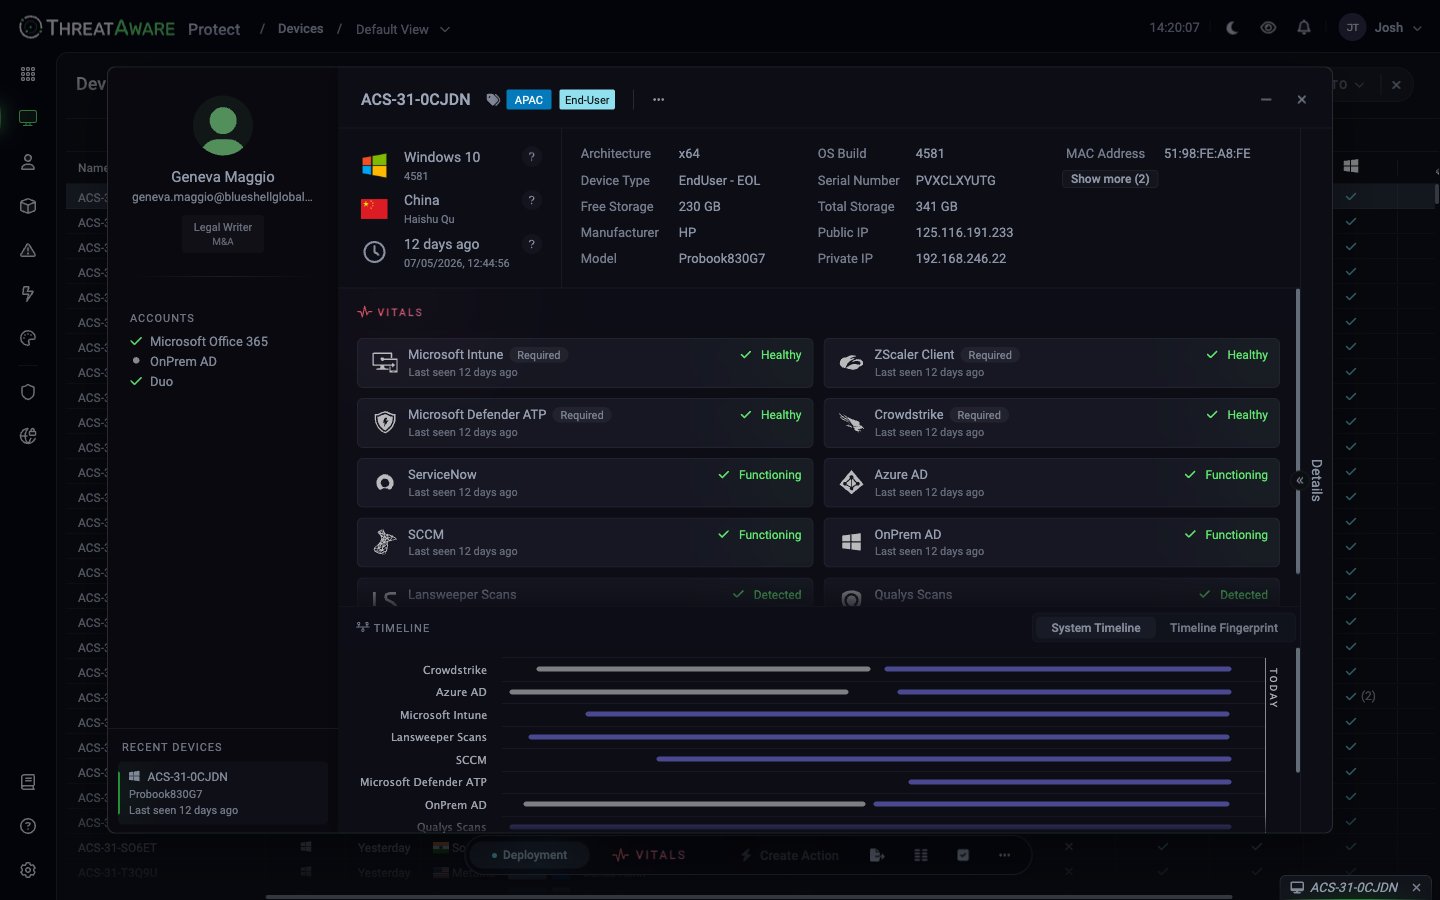
Click any row to open the device detail panel on the right.
## Column architecture
Columns are organised into five groups:
| Group | What's in it |
| ----------------------- | ----------------------------------------------------------------- |
| **Device Details** | `Name`, `OS`, `Last Online`, `Location`, `Tags` |
| **User Details** | `Last User` |
| **Advanced Monitoring** | One column per EDR / MDM / vulnerability / monitoring integration |
| **Discovery** | One column per directory / identity / inventory integration |
| **Network Scanning** | One column per network discovery tool |
In **Deployment view** each integration column is a check / no-check ("does this device exist in this tool?"). In **Vitals view** the same column shows Healthy / Functioning / Misconfigured / Not Healthy. Toggle in the bottom-left of the page footer.
## Default vs custom columns
The default column set is intentionally minimal — Name, OS, Last Online, Location, Tags, Last User, plus the integration columns. Hundreds of additional fields are available via the **column editor** (grid icon, bottom-right of the page):
`metadata.serial_number`, `metadata.manufacturer`, `metadata.model`, `metadata.cpu_model`, `metadata.cpu_cores`, `metadata.cpu_speed`, `metadata.total_ram`, `metadata.total_storage`, `metadata.free_storage`, `metadata.architecture`, `metadata.disk_type`, `metadata.video_card`, `metadata.warranty_expiry`
`privateIp`, `publicIp`, `macAddress`, `metadata.domain`, `location.country`, `location.city`, `location.countryCode`, `location.coordinates`
`lastUser.email`, `lastUser.name`, `lastUser.department`, `lastUser.jobTitle`
`os` (enum: Windows / MacOs / Linux), `osVersion`, `metadata.os_build`, `lastLogin`, `lastOnline`
`system..required`, `system..deployed`, `system..functioning`, `system..configuredCorrectly` (booleans, one set per connected integration — see [Reference → Vitals states](/reference/vitals-states))
Click any column header's gear to **sort**, **filter directly on that column**, or **enter Configure Mode** (for Vital columns — see [Vitals Configuration](/vitals-configuration)).
## The device detail panel
Click any row to open the device detail panel on the right.
 ### Top tab strip
The detail panel preserves a tab strip — opening another device adds a new tab. This lets you compare devices side-by-side without losing context. Close tabs with the × on each.
### Left sidebar — user card
Shows the device's primary user:
* Avatar + name + email + role
* **Accounts**: which identity sources show this user (Microsoft 365, OnPrem AD, Duo, etc.)
* **Recent Devices**: other devices this user has signed into recently
### Main area
* **Device header**: name, OS (icon + version + build), Architecture, MAC, Serial, Manufacturer, Model, Domain
* **Issues** button: jumps to [Issues](/issues) filtered to this device
* **Vitals tiles**: a tile per integration with Required tag and current state (Healthy / Functioning / Misconfigured)
* **Activity Timeline**: per-integration last-seen bars over time — visual proof of which tools have been talking to this device when
* **Tags**: every tag the Logic Engine has applied
### Bottom action bar
* **Deployment** / **Vitals** toggle (same as the grid)
* **Create Action** (active when one or more devices are selected in the grid)
* Quick actions: export this device, copy link, refresh, additional actions
## Active vs Inactive devices
Protect distinguishes Active from Inactive devices by the **Inactive device threshold** in [Settings → Misc](/settings/misc) (default `30` days).
| State | Definition | Default visibility |
| ------------ | ---------------------------------------------------------- | ------------------------------- |
| **Active** | Seen on at least one connected system within the threshold | Shown by default |
| **Inactive** | Not seen anywhere for longer than the threshold | Hidden unless filter is changed |
The Devices grid defaults to Active. The **Active ▾** pill at the left of the search bar switches between Active ("Devices that are currently active") and Inactive ("Devices that are currently inactive"). It is a UI toggle — there is no `state` field in the query language.
**Virtual machines** can be marked Inactive immediately if a cloud or virtualisation integration reports them as terminated, regardless of last-seen date. This prevents terminated cloud VMs from inflating your active counts.
## Deduplication & matching
A single physical device often reports from 5+ tools. Protect uses a patented timeline-matching algorithm with these signals (in order of reliability):
| Signal | Reliability |
| -------------------- | ------------------------------------ |
| Serial number | Highest — unique per physical device |
| Machine name | High — but can change or be reused |
| MAC address | High — but VMs may share MACs |
| User association | Medium |
| Timeline correlation | Supporting factor |
A single device record is created once, with all source data attached. Hover the integration columns to see which tools each device reports from — or open [X-Ray](/x-ray) for the full breakdown.
### Edge cases
Common in cloned environments. Matching falls through to hostname + IP + timeline, with the source-tool device-id as a final tiebreaker.
Same name on a new physical machine. Serial number plus First Seen date distinguishes them; the previous device falls into Inactive after the threshold.
For multi-user devices, the most recent user becomes Primary; historical users are retained for audit.
If you see two rows that should be one, open [X-Ray](/x-ray) on each — if there's no shared field, they really are different devices and matching is correct. If there's an overlap (same serial in different tools), open a support ticket.
## Search, filter, save
The search bar accepts:
* Free text against `Name` (`ACS-31-`)
* The full [query language](/query-language) (`os:Windows AND tags:End-User`)
* Natural language in AI-enabled tenants
Once you've built a useful filter:
1. **Save View** — bottom-left of the grid
2. **Name** it
3. **Visibility**: Private / Team / Everyone
4. Saved views appear in the **Default View** dropdown (top-right)
The same saved-view system underpins [Scheduled Reports](/scheduled-reports) — you reference a saved view to schedule it.
## From inventory to action
The flow:
1. **Build a query** in Devices.
2. **Save the View** — or schedule a recurring CSV / JSON / XLSX export from the saved view.
3. **Select rows + Create Action** — choose Continuous (always-on) or Snapshot (fixed scope), then pick the channel(s): email, ticket, webhook, Teams, or Power Automate.
See [Action Center](/automation) for the Action half.
## Export
All grids can export:
* **CSV** — current columns, current filter, current sort
* **JSON** — full structured record for each row including nested integration data
* **XLSX** — formatted Excel
Maximum export size: 100,000 rows. For larger sets use the [API](/api-reference/introduction) or split by tag.
## Tips
**The column editor is your most-used tool.** Reach for it whenever you find yourself adding a clause to your query — there's often a column that surfaces the same information.
**Use the Tab strip on the detail panel.** Comparing three devices? Open three tabs. The strip persists until you close them.
**Vitals view is for action; Deployment view is for audit.** Switch to Deployment when you need to prove *"we have this many devices in CrowdStrike"*. Switch to Vitals when you're triaging *"how many of those are actually healthy?"*.
## Cross-references
The full search syntax
Raw data per device
Define what controls are required
Turn filtered views into automation
Automatic device categorisation
Recurring CSV/JSON/XLSX delivery
### Top tab strip
The detail panel preserves a tab strip — opening another device adds a new tab. This lets you compare devices side-by-side without losing context. Close tabs with the × on each.
### Left sidebar — user card
Shows the device's primary user:
* Avatar + name + email + role
* **Accounts**: which identity sources show this user (Microsoft 365, OnPrem AD, Duo, etc.)
* **Recent Devices**: other devices this user has signed into recently
### Main area
* **Device header**: name, OS (icon + version + build), Architecture, MAC, Serial, Manufacturer, Model, Domain
* **Issues** button: jumps to [Issues](/issues) filtered to this device
* **Vitals tiles**: a tile per integration with Required tag and current state (Healthy / Functioning / Misconfigured)
* **Activity Timeline**: per-integration last-seen bars over time — visual proof of which tools have been talking to this device when
* **Tags**: every tag the Logic Engine has applied
### Bottom action bar
* **Deployment** / **Vitals** toggle (same as the grid)
* **Create Action** (active when one or more devices are selected in the grid)
* Quick actions: export this device, copy link, refresh, additional actions
## Active vs Inactive devices
Protect distinguishes Active from Inactive devices by the **Inactive device threshold** in [Settings → Misc](/settings/misc) (default `30` days).
| State | Definition | Default visibility |
| ------------ | ---------------------------------------------------------- | ------------------------------- |
| **Active** | Seen on at least one connected system within the threshold | Shown by default |
| **Inactive** | Not seen anywhere for longer than the threshold | Hidden unless filter is changed |
The Devices grid defaults to Active. The **Active ▾** pill at the left of the search bar switches between Active ("Devices that are currently active") and Inactive ("Devices that are currently inactive"). It is a UI toggle — there is no `state` field in the query language.
**Virtual machines** can be marked Inactive immediately if a cloud or virtualisation integration reports them as terminated, regardless of last-seen date. This prevents terminated cloud VMs from inflating your active counts.
## Deduplication & matching
A single physical device often reports from 5+ tools. Protect uses a patented timeline-matching algorithm with these signals (in order of reliability):
| Signal | Reliability |
| -------------------- | ------------------------------------ |
| Serial number | Highest — unique per physical device |
| Machine name | High — but can change or be reused |
| MAC address | High — but VMs may share MACs |
| User association | Medium |
| Timeline correlation | Supporting factor |
A single device record is created once, with all source data attached. Hover the integration columns to see which tools each device reports from — or open [X-Ray](/x-ray) for the full breakdown.
### Edge cases
Common in cloned environments. Matching falls through to hostname + IP + timeline, with the source-tool device-id as a final tiebreaker.
Same name on a new physical machine. Serial number plus First Seen date distinguishes them; the previous device falls into Inactive after the threshold.
For multi-user devices, the most recent user becomes Primary; historical users are retained for audit.
If you see two rows that should be one, open [X-Ray](/x-ray) on each — if there's no shared field, they really are different devices and matching is correct. If there's an overlap (same serial in different tools), open a support ticket.
## Search, filter, save
The search bar accepts:
* Free text against `Name` (`ACS-31-`)
* The full [query language](/query-language) (`os:Windows AND tags:End-User`)
* Natural language in AI-enabled tenants
Once you've built a useful filter:
1. **Save View** — bottom-left of the grid
2. **Name** it
3. **Visibility**: Private / Team / Everyone
4. Saved views appear in the **Default View** dropdown (top-right)
The same saved-view system underpins [Scheduled Reports](/scheduled-reports) — you reference a saved view to schedule it.
## From inventory to action
The flow:
1. **Build a query** in Devices.
2. **Save the View** — or schedule a recurring CSV / JSON / XLSX export from the saved view.
3. **Select rows + Create Action** — choose Continuous (always-on) or Snapshot (fixed scope), then pick the channel(s): email, ticket, webhook, Teams, or Power Automate.
See [Action Center](/automation) for the Action half.
## Export
All grids can export:
* **CSV** — current columns, current filter, current sort
* **JSON** — full structured record for each row including nested integration data
* **XLSX** — formatted Excel
Maximum export size: 100,000 rows. For larger sets use the [API](/api-reference/introduction) or split by tag.
## Tips
**The column editor is your most-used tool.** Reach for it whenever you find yourself adding a clause to your query — there's often a column that surfaces the same information.
**Use the Tab strip on the detail panel.** Comparing three devices? Open three tabs. The strip persists until you close them.
**Vitals view is for action; Deployment view is for audit.** Switch to Deployment when you need to prove *"we have this many devices in CrowdStrike"*. Switch to Vitals when you're triaging *"how many of those are actually healthy?"*.
## Cross-references
The full search syntax
Raw data per device
Define what controls are required
Turn filtered views into automation
Automatic device categorisation
Recurring CSV/JSON/XLSX delivery