> ## Documentation Index
> Fetch the complete documentation index at: https://docs.threataware.com/llms.txt
> Use this file to discover all available pages before exploring further.
# Issues
> The real-time list of every detected problem across every connected source
**Tier:** Issues is derived from Vitals state — included with **Discover** and **Protect**. Customers on Connect do not see Issues.
## What an Issue is
An **Issue** is a discrete, named problem detected on a specific device by a specific integration. Examples:
* **Agent Inactive** — "Agent not seen for over 30 days but device has been online"
* **Agent Missing** — "Agent not installed on computer"
* **Device Not Registered** — "Computer \[name] is not registered"
* **Not Compliant** — "Device compliance status is: "unknown""
* **Not Encrypted** — "Device is not encrypted"
* **Feature Disabled** — vendor-side feature should be on but isn't
* **Exposure Level** — vendor exposure score for the device
* **ZDX Disabled** / **ZDX Inactive** — ZScaler Client Digital Experience checks
Issue names are vendor-specific — the catalogue you see depends on which integrations are connected.
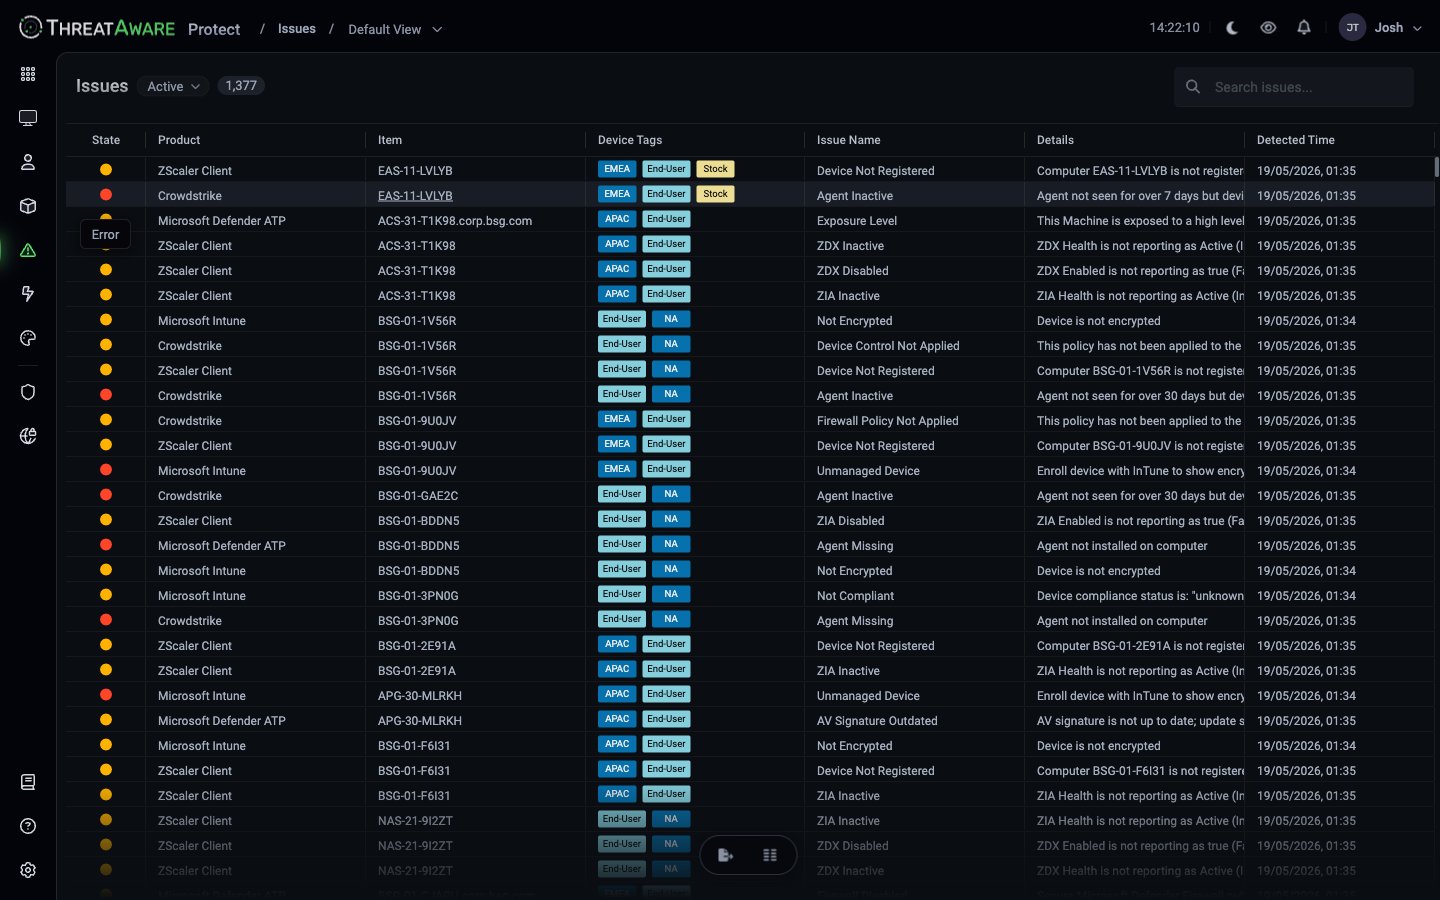 ## Grid layout
| Column | Description |
| ----------------- | --------------------------------------------------------------------------------------------------------------------- |
| **State** | Coloured dot indicator (amber / red) |
| **Product** | The integration that reported the Issue (Crowdstrike, Microsoft Defender ATP, Microsoft Intune, ZScaler Client, etc.) |
| **Item** | Affected device hostname — clickable, opens the device detail panel |
| **Device Tags** | Tags carried by the affected device |
| **Issue Name** | Short, integration-specific label (`Agent Inactive`, `Not Encrypted`, …) |
| **Details** | One-line explanation with the relevant context |
| **Detected Time** | When the Issue was first observed in this state (e.g. `21/05/2026, 01:35`) |
The grid supports the same column editor, sorts, and saved views as [Devices](/device-management).
## State indicator
The State column shows a coloured dot. Two states are visible in the live demo:
| Colour | Meaning |
| --------- | -------------------------------------------------------------------------- |
| Red dot | More severe — agent missing, feature disabled, or critical control failure |
| Amber dot | Lower severity — drift, inactive checks, advisory issues |
## Filtering
The Issues grid has a plain **Search issues...** box for substring filtering. The top-left **Active ▾** pill scopes the grid.
For more structured filtering, build a saved view from the column filters in the grid header.
## From Issue → Action
The Issues grid integrates with the [Action Center](/automation):
1. Build a filter that captures the issue cohort you want to remediate
2. Use the footer's **Create Action** flow (same as Devices)
3. Pick **Continuous** so future matching issues are auto-added
4. Choose automation — email, ticket, webhook, Power Automate
When the underlying Issue resolves (e.g. CrowdStrike starts reporting again), the device automatically leaves the Action, the Action's Success Rate ticks up, and the MTTR drops.
## What Issues are vs. what Vitals are
| Concept | Where it lives | What it answers |
| --------- | --------------------------- | -------------------------------------------------------------------------------------------------- |
| **Vital** | Per-device, per-control | *Is CrowdStrike healthy on this device — required / deployed / functioning / configuredCorrectly?* |
| **Issue** | Per-detection, time-stamped | *A specific problem fired by an integration* |
A device with an unhealthy Vital usually has one or more underlying Issues. The Issues page is the operational queue; Vitals are the structured posture model.
## Common triage workflows
1. Sort by **Detected Time** ascending so the oldest issues bubble up
2. For each row: click the device → review the X-Ray panel → confirm root cause
3. If multiple devices show the same issue name from the same integration, escalate to engineering (it's likely a tool-side problem, not field-side)
4. Otherwise create or assign to an existing Action
1. Filter by **Product** = Crowdstrike (or Defender, Intune, etc.)
2. Filter by **Issue Name** = Agent Inactive / Agent Missing
3. Group by **Device Tags** to spot hotspots (a region or device-class with disproportionate broken agents)
4. Create a Snapshot Action with a deadline for remediation
1. Filter by date range covering the audit period using the **Detected Time** column filter
2. Export CSV
3. Pair with [Action Center](/automation) automation log to show what was done about each Issue
4. Reference [Audit Log](/settings/audit-log) for platform-level actions
## Cross-references
Configure the Vitals that surface Issues
See the raw data behind any Issue
Turn Issues into automated remediation
## Grid layout
| Column | Description |
| ----------------- | --------------------------------------------------------------------------------------------------------------------- |
| **State** | Coloured dot indicator (amber / red) |
| **Product** | The integration that reported the Issue (Crowdstrike, Microsoft Defender ATP, Microsoft Intune, ZScaler Client, etc.) |
| **Item** | Affected device hostname — clickable, opens the device detail panel |
| **Device Tags** | Tags carried by the affected device |
| **Issue Name** | Short, integration-specific label (`Agent Inactive`, `Not Encrypted`, …) |
| **Details** | One-line explanation with the relevant context |
| **Detected Time** | When the Issue was first observed in this state (e.g. `21/05/2026, 01:35`) |
The grid supports the same column editor, sorts, and saved views as [Devices](/device-management).
## State indicator
The State column shows a coloured dot. Two states are visible in the live demo:
| Colour | Meaning |
| --------- | -------------------------------------------------------------------------- |
| Red dot | More severe — agent missing, feature disabled, or critical control failure |
| Amber dot | Lower severity — drift, inactive checks, advisory issues |
## Filtering
The Issues grid has a plain **Search issues...** box for substring filtering. The top-left **Active ▾** pill scopes the grid.
For more structured filtering, build a saved view from the column filters in the grid header.
## From Issue → Action
The Issues grid integrates with the [Action Center](/automation):
1. Build a filter that captures the issue cohort you want to remediate
2. Use the footer's **Create Action** flow (same as Devices)
3. Pick **Continuous** so future matching issues are auto-added
4. Choose automation — email, ticket, webhook, Power Automate
When the underlying Issue resolves (e.g. CrowdStrike starts reporting again), the device automatically leaves the Action, the Action's Success Rate ticks up, and the MTTR drops.
## What Issues are vs. what Vitals are
| Concept | Where it lives | What it answers |
| --------- | --------------------------- | -------------------------------------------------------------------------------------------------- |
| **Vital** | Per-device, per-control | *Is CrowdStrike healthy on this device — required / deployed / functioning / configuredCorrectly?* |
| **Issue** | Per-detection, time-stamped | *A specific problem fired by an integration* |
A device with an unhealthy Vital usually has one or more underlying Issues. The Issues page is the operational queue; Vitals are the structured posture model.
## Common triage workflows
1. Sort by **Detected Time** ascending so the oldest issues bubble up
2. For each row: click the device → review the X-Ray panel → confirm root cause
3. If multiple devices show the same issue name from the same integration, escalate to engineering (it's likely a tool-side problem, not field-side)
4. Otherwise create or assign to an existing Action
1. Filter by **Product** = Crowdstrike (or Defender, Intune, etc.)
2. Filter by **Issue Name** = Agent Inactive / Agent Missing
3. Group by **Device Tags** to spot hotspots (a region or device-class with disproportionate broken agents)
4. Create a Snapshot Action with a deadline for remediation
1. Filter by date range covering the audit period using the **Detected Time** column filter
2. Export CSV
3. Pair with [Action Center](/automation) automation log to show what was done about each Issue
4. Reference [Audit Log](/settings/audit-log) for platform-level actions
## Cross-references
Configure the Vitals that surface Issues
See the raw data behind any Issue
Turn Issues into automated remediation