> ## Documentation Index
> Fetch the complete documentation index at: https://docs.threataware.com/llms.txt
> Use this file to discover all available pages before exploring further.
# Reporting
> Dashboard, scheduled exports, and the AI-powered Reporting app builder — turning data into deliverables
**Tier:** Basic exports (CSV / JSON / XLSX) and saved views are available across all tiers. The **AI Advanced Reporting** app builder is included in the **Protect** tier. The **Control Health Dashboard** ships with **Discover** and **Protect**.
## The three reporting surfaces
Protect offers three layered approaches to reporting:
| Surface | Audience | Refresh | Format |
| ----------------------------- | ----------------------------- | ------------------------------------------------ | --------------------------------- |
| **Dashboard** | Inside-the-product visibility | Live | Interactive |
| **Scheduled Reports** | Email-delivered to a list | Recurring (Daily / Weekly / Monthly / Quarterly) | CSV / JSON / XLSX |
| **Reporting (AI-built apps)** | Custom apps + PDF generation | Live (apps) or on-demand (PDFs) | Interactive apps, exportable PDFs |
Pick the surface that matches the audience: leadership wants Reporting dashboards and scheduled PDF; the security ops team wants the Dashboard left open on a screen; auditors want scheduled XLSX deliveries.
## Dashboard
[Platform Overview → Dashboard](/platform-overview#dashboard) covers the layout. Use it for:
* **Daily standup background** — leave the Overall Control Health trend visible
* **NOC / SOC big-screen** — Integration Control panel as a wall display
* **Leadership walkthroughs** — Estate Summary + Actions Summary tells the story without a slide
The Dashboard refreshes continuously. There's nothing to schedule — opening the page shows current state.
## Scheduled Reports
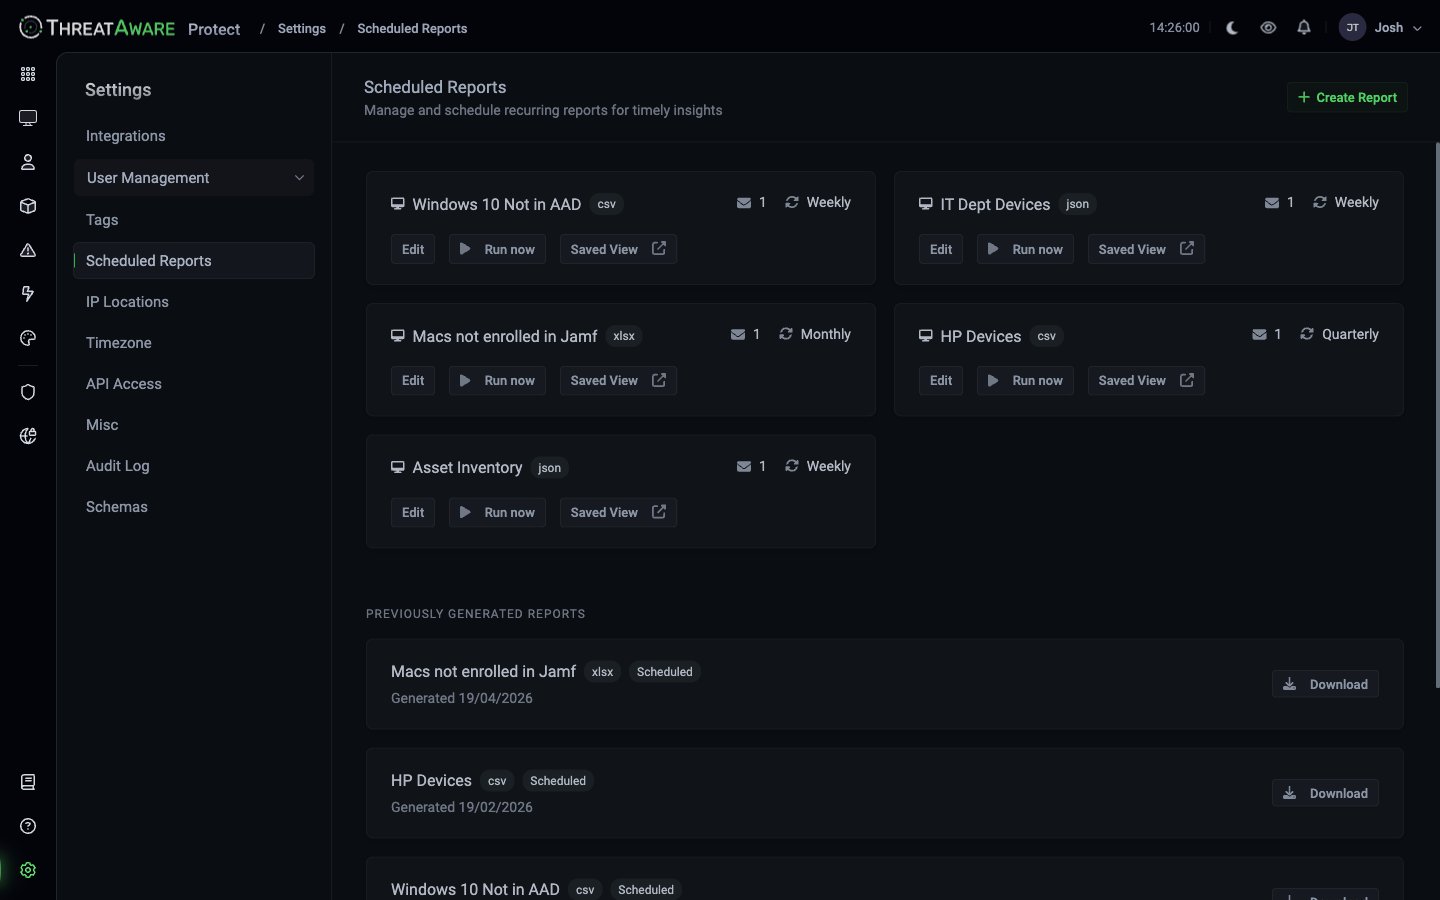
[Settings → Scheduled Reports](/settings/scheduled-reports) is where you set up recurring email deliveries.
 ### How it works
Every scheduled report references a **Saved View** (built in Devices, Users, Software, or Issues). At each scheduled time, the report exports the current contents of that view and emails the file.
| Configurable | Options |
| -------------- | --------------------------------------------------------------- |
| **Saved View** | Any view you have access to |
| **Format** | CSV, JSON, XLSX |
| **Frequency** | Daily, Weekly (pick day of week), Monthly (pick day), Quarterly |
| **Time** | HH:MM in tenant timezone |
| **Recipients** | One or more email addresses |
### Example schedules
| Report name | Format | Schedule |
| ------------------------- | ------ | -------- |
| Macs not enrolled in Jamf | json | Weekly |
| HP Devices | xlsx | Monthly |
| Windows 10 Not in AAD | xlsx | Weekly |
| Asset Inventory | json | Monthly |
| IT Dept Devices | csv | Weekly |
### Previously generated reports
Below the live schedules, **PREVIOUSLY GENERATED REPORTS** shows every past delivery with a **Download** button. Useful when:
* Recipient lost the email
* An auditor wants a specific historic snapshot
* You need to compare period-over-period
Reports are retained per your tenant's retention policy.
### Limitations
**Scheduled reports are point-in-time snapshots.** They contain the data at the moment of generation — not a live link to the view. For real-time data, point users at the saved view in the product or build a [Reporting](#reporting-ai-powered-apps) app.
**Max 100,000 rows per report.** Large exports may also hit email-provider attachment limits (typically 25 MB). Either split by tag or use the [API](/api-reference/introduction) for large exports.
## Reporting (AI-powered apps)
Reporting is the deepest layer — natural-language-built custom dashboards and tools, accessed from the left rail (palette icon, `/studio/editor`). The Composer reads directly from Protect's device, user, and software schemas. Use it when:
* The Dashboard doesn't show what you need
* Scheduled CSV/JSON isn't interactive enough
* You want stakeholders to consume reports in-product, not via email
* You need PDF generation with custom branding
* You want to build internal tools beyond reporting (wizards, validation forms, lifecycle tools)
### How it works
Every scheduled report references a **Saved View** (built in Devices, Users, Software, or Issues). At each scheduled time, the report exports the current contents of that view and emails the file.
| Configurable | Options |
| -------------- | --------------------------------------------------------------- |
| **Saved View** | Any view you have access to |
| **Format** | CSV, JSON, XLSX |
| **Frequency** | Daily, Weekly (pick day of week), Monthly (pick day), Quarterly |
| **Time** | HH:MM in tenant timezone |
| **Recipients** | One or more email addresses |
### Example schedules
| Report name | Format | Schedule |
| ------------------------- | ------ | -------- |
| Macs not enrolled in Jamf | json | Weekly |
| HP Devices | xlsx | Monthly |
| Windows 10 Not in AAD | xlsx | Weekly |
| Asset Inventory | json | Monthly |
| IT Dept Devices | csv | Weekly |
### Previously generated reports
Below the live schedules, **PREVIOUSLY GENERATED REPORTS** shows every past delivery with a **Download** button. Useful when:
* Recipient lost the email
* An auditor wants a specific historic snapshot
* You need to compare period-over-period
Reports are retained per your tenant's retention policy.
### Limitations
**Scheduled reports are point-in-time snapshots.** They contain the data at the moment of generation — not a live link to the view. For real-time data, point users at the saved view in the product or build a [Reporting](#reporting-ai-powered-apps) app.
**Max 100,000 rows per report.** Large exports may also hit email-provider attachment limits (typically 25 MB). Either split by tag or use the [API](/api-reference/introduction) for large exports.
## Reporting (AI-powered apps)
Reporting is the deepest layer — natural-language-built custom dashboards and tools, accessed from the left rail (palette icon, `/studio/editor`). The Composer reads directly from Protect's device, user, and software schemas. Use it when:
* The Dashboard doesn't show what you need
* Scheduled CSV/JSON isn't interactive enough
* You want stakeholders to consume reports in-product, not via email
* You need PDF generation with custom branding
* You want to build internal tools beyond reporting (wizards, validation forms, lifecycle tools)
 ### The editor
The Reporting editor has two main panels:
| Panel | Purpose |
| -------------------- | ------------------------------------------- |
| **Left — Preview** | Live render of your app with your real data |
| **Right — Composer** | AI chat where you describe what to build |
### Build mode vs. View mode
Top tabs:
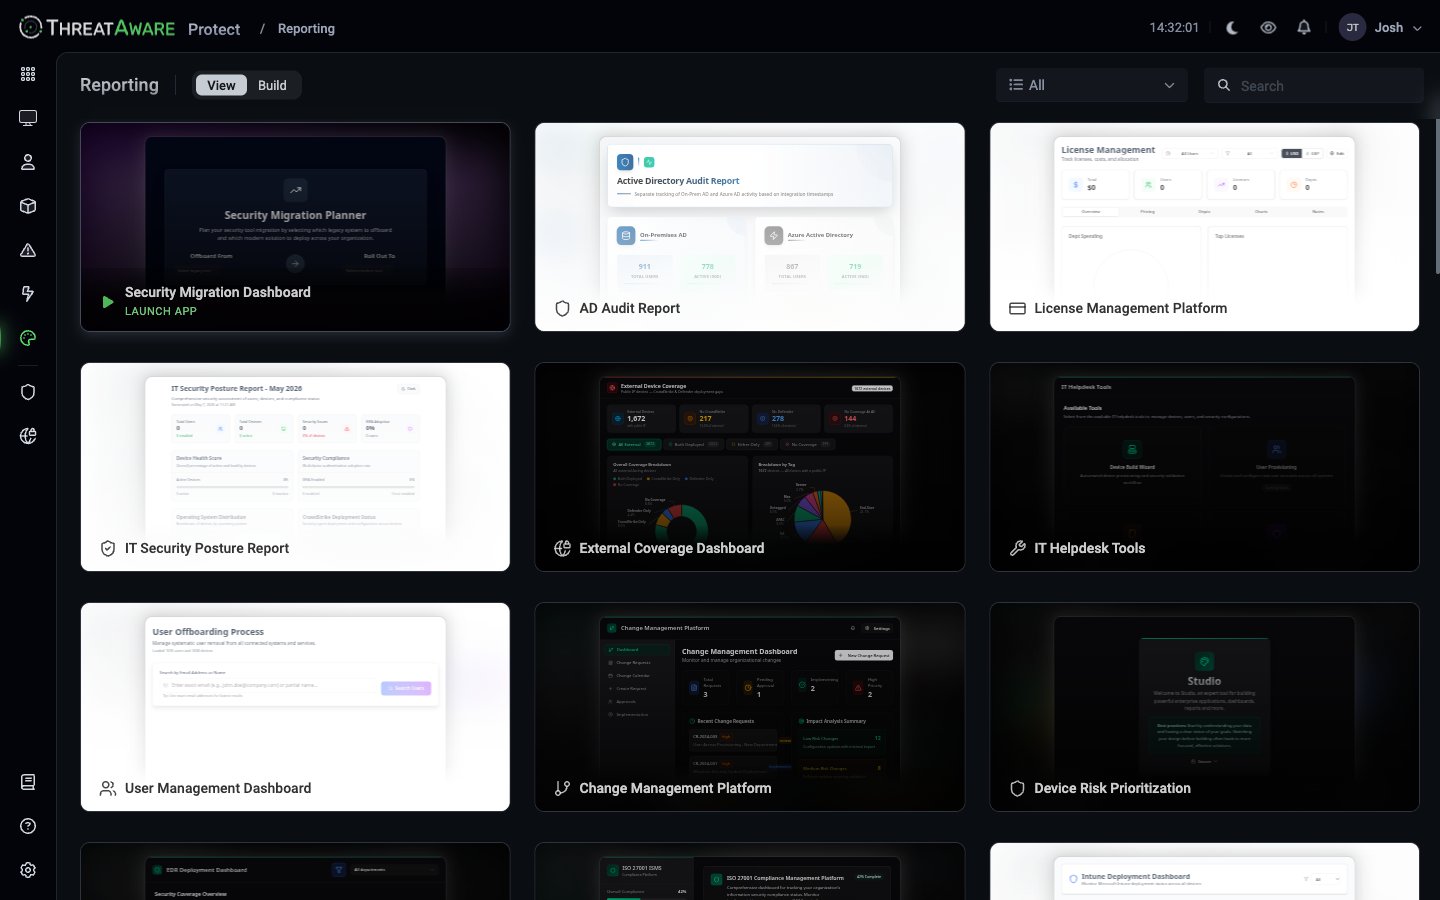
* **View** — see published apps (the gallery)
* **Build** — see apps in edit mode + start new ones from templates
In **Build** mode you can:
* Edit an existing app via the 3-dot menu → Edit
* Start from a template (Blank Canvas, Default, Dashboard Manager)
* Click `+ New` to start from scratch
### What's shipped out of the box
Pre-built apps available out of the box:
| App | Purpose |
| ------------------------------- | ------------------------------------------- |
| **IT Security Posture Report** | Overall control health for SecOps |
| **AD Audit Report** | Active Directory hygiene + dormant accounts |
| **License Management Platform** | License spend + reclaim opportunities |
| **Security Migration Planner** | OS migration progress tracker |
| **External Coverage Dashboard** | EDR / MDM coverage by region |
| **IT Helpdesk Tools** | Device lookup + remediation workflows |
| **User Offboarding Dashboard** | Joiner-mover-leaver checklist |
| **Change Management Platform** | Track configuration changes over time |
| **Device Risk Prioritization** | Rank devices by exposure |
These are starting points — clone any of them via the 3-dot menu → Clone to begin a customised version.
### Building with natural language
The Composer accepts conversational prompts. Build incrementally — one change per prompt.
```text theme={null}
Create a dashboard showing our security posture.
Add a large metric card at the top showing total devices.
```
```text theme={null}
Below the metric, add a donut chart showing devices grouped by manufacturer.
Show percentages on the chart and sort by count, largest first.
```
```text theme={null}
Add three metric cards in a row showing:
1. Devices with healthy EDR
2. Devices encrypted
3. Devices with critical issues
```
```text theme={null}
Add a dropdown filter at the top right to filter by department tag.
Add a search box to filter the device table.
```
```text theme={null}
Use our corporate colours: primary #16A34A, secondary #07C983.
Make the metric cards larger with bold numbers.
```
### What the AI can and can't see
Reporting uses a privacy-by-design model:
The AI sees **schema** — field names and types (`deviceName: string`, `lastOnline: timestamp`)
The AI sees **your prompts** — what you describe wanting
The AI sees **the code it's writing**
The AI does **not** see actual data values — never your device names, user emails, IP addresses, or any field contents. When the app runs in preview, Protect executes the AI-generated code against your data on your side. The AI only sees the structure.
The schema is configurable at [Settings → Schemas](/settings/schemas) — Device Data and User Data have X-Ray views showing exactly what the AI sees.
### Components available
The Reporting component library covers 46 components across 7 categories:
| Category | Components |
| --------------------- | ------------------------------------------------------------------------------------------------ |
| **General** | Text, Heading, Card, Container, Divider, Badge, Avatar |
| **Form** | Input, Textarea, Select, Multi-select, Checkbox, Radio, Date picker, File upload, Slider, Switch |
| **Popups & Overlays** | Modal, Drawer, Popover, Tooltip, Toast |
| **Navigation** | Tabs, Stepper, Breadcrumb, Pagination, Menu |
| **Layout** | Grid, Stack, Spacer, Divider, Accordion |
| **Charts & Graphs** | Line, Bar, Donut/Pie, Area, Scatter, Sparkline, Gauge, Heatmap |
| **Tables & Data** | Table, Data Grid, KPI Card, Stat, Metric |
### Publishing and pinning
When you publish an app:
| Visibility | Who sees it |
| ------------ | -------------------------------------- |
| **Private** | Only you (drafts, personal dashboards) |
| **Team** | One or more selected teams |
| **Everyone** | All Protect users with access |
After publishing, click **Pin to Sidebar** on the app to add it to the Protect left rail. Pinned apps become first-class navigation alongside Devices, Issues, and the Action Center.
### PDF generation
Most apps support **Generate PDF** from the app's 3-dot menu:
* A4 / A3 paper size
* Portrait / landscape orientation
* One-shot now, or schedule recurring (where available)
Use this for board-deck appendices, audit submissions, and MSP client deliverables.
### Editing safely
Edits stay in Build mode until you Publish. The Published version stays live until promoted.
If you make a mistake, restore the last published version. The Composer logs every checkpoint.
For risky redesigns, clone the app first ("App v2"), iterate there, then replace the original when ready.
Add changelog entries in the app's description so future maintainers understand evolution.
### Code ownership
Every app's code is yours:
* The AI writes React + TypeScript code
* You can view it via the source viewer (the `` icon)
* You can download the full package
* You can run it outside Protect in your own React environment
Reporting is a generator that gives you working code, not a black box. If you outgrow conversational editing, take the export and modify it directly.
### Example: weekly executive summary
```text theme={null}
Build me an executive summary dashboard.
Top: title "Weekly Security Summary" with the current date.
Three KPI cards in a row:
1. EDR coverage % across End-User devices
2. MFA enrolment % across all users
3. Critical issues count
Below: a line chart of overall posture % over the last 30 days.
Below that: a table of the top 10 devices by issue count,
columns: Device Name, User, Last Online, Issue Count.
Use my corporate colours: primary #16A34A.
```
The AI builds this in 60-90 seconds. Iterate on layout, colours, copy via follow-up prompts. Publish as Team-visible. Pin to sidebar. Generate weekly PDF via Schedule.
## Common report patterns
**Question**: which devices don't have a required control?
1. In Devices, query: `tags:End-User AND system.crowdstrike.required:true AND system.crowdstrike.deployed:false`
2. Save view as "End-User Devices Missing CrowdStrike"
3. Schedule: Weekly CSV to [security-ops@company.com](mailto:security-ops@company.com), Monday 8am
4. Pair with a [Continuous Action](/automation) on the same query for automated remediation
**Question**: which agents are deployed but not functioning?
1. Query: `(system.crowdstrike.deployed:true AND system.crowdstrike.functioning:false) OR (system.microsoft_defender_atp.deployed:true AND system.microsoft_defender_atp.functioning:false)`
2. Save view as "Broken Security Agents"
3. Schedule: Daily CSV to [soc@company.com](mailto:soc@company.com), weekday mornings
4. Why it works: Protect computes the not-functioning state from cross-tool comparison — the single-tool console cannot
**Question**: what % of devices are fully compliant against our baseline?
1. Build the query that captures *compliant* devices (`tags:End-User AND system.crowdstrike.deployed:true AND system.crowdstrike.functioning:true AND system.microsoft_intune.deployed:true AND ...`)
2. Save view as "End-User Compliant"
3. Build a Reporting app that surfaces the percentage with a gauge + trend
4. Schedule: Reporting PDF export via the app's Generate PDF — Monthly to leadership
**Question**: how is our Win10 → Win11 migration progressing?
1. Create a Snapshot [Action](/automation) capturing the current set of Win10 devices
2. Action card shows N / Total with progress bar
3. For weekly leadership reporting, build a Reporting dashboard that pulls from the same query and adds historical trend
4. Schedule: Weekly XLSX of unresolved devices to [migration-team@company.com](mailto:migration-team@company.com)
**Question**: monthly compliance report for Client Acme
1. Build views filtered by `tags:Acme`
2. Reporting app with company branding (Acme logo, colours) showing key metrics
3. PDF export, scheduled monthly
4. Send via the Reporting app's Schedule feature (where available) or via an outbound automation that pulls the saved view XLSX
## Export formats
| Format | Best for |
| ----------------------- | --------------------------------------------------------- |
| **CSV** | Excel analysis, BI tool import, sharing with stakeholders |
| **JSON** | Programmatic processing, scripts, data warehouse ingest |
| **XLSX** | Direct Excel consumption with formatting preserved |
| **PDF (via Reporting)** | Executive presentations, audit deliverables |
## Audience-tailored cadence
A working rhythm that scales:
| Audience | Cadence | Channel | Format |
| ------------------- | --------- | ------------------ | ----------------------------- |
| SOC analysts | Daily | Email + screen | CSV / Dashboard |
| Department IT leads | Weekly | Email | XLSX |
| CISO / leadership | Monthly | Email + meeting | PDF (Reporting) |
| Board | Quarterly | Meeting + appendix | PDF (Reporting) |
| Auditor | On-demand | Email | XLSX + audit log export |
| MSP client | Monthly | Email | PDF (Reporting with branding) |
## Best practices
Mondays at 8am for operational teams. First-of-the-month for management. Avoid Friday evening (no one reads them).
A daily report to 30 people is a daily delete to 28 people. Right person, right cadence.
In the report description, name the human responsible for the underlying view. When metrics change unexpectedly, recipients know who to ask.
Monthly compliance reports should be saved to a long-retention bucket. The Settings → Scheduled Reports previously-generated list is a convenience, not a compliance archive.
If a report has been alerting on the same 12 devices for three months, the underlying problem isn't visibility — it's that no one is acting. Wire an Action onto the same query.
## Cross-references
The admin page
What the AI can see
Where saved views are built
Pair every report with an action
### The editor
The Reporting editor has two main panels:
| Panel | Purpose |
| -------------------- | ------------------------------------------- |
| **Left — Preview** | Live render of your app with your real data |
| **Right — Composer** | AI chat where you describe what to build |
### Build mode vs. View mode
Top tabs:
* **View** — see published apps (the gallery)
* **Build** — see apps in edit mode + start new ones from templates
In **Build** mode you can:
* Edit an existing app via the 3-dot menu → Edit
* Start from a template (Blank Canvas, Default, Dashboard Manager)
* Click `+ New` to start from scratch
### What's shipped out of the box
Pre-built apps available out of the box:
| App | Purpose |
| ------------------------------- | ------------------------------------------- |
| **IT Security Posture Report** | Overall control health for SecOps |
| **AD Audit Report** | Active Directory hygiene + dormant accounts |
| **License Management Platform** | License spend + reclaim opportunities |
| **Security Migration Planner** | OS migration progress tracker |
| **External Coverage Dashboard** | EDR / MDM coverage by region |
| **IT Helpdesk Tools** | Device lookup + remediation workflows |
| **User Offboarding Dashboard** | Joiner-mover-leaver checklist |
| **Change Management Platform** | Track configuration changes over time |
| **Device Risk Prioritization** | Rank devices by exposure |
These are starting points — clone any of them via the 3-dot menu → Clone to begin a customised version.
### Building with natural language
The Composer accepts conversational prompts. Build incrementally — one change per prompt.
```text theme={null}
Create a dashboard showing our security posture.
Add a large metric card at the top showing total devices.
```
```text theme={null}
Below the metric, add a donut chart showing devices grouped by manufacturer.
Show percentages on the chart and sort by count, largest first.
```
```text theme={null}
Add three metric cards in a row showing:
1. Devices with healthy EDR
2. Devices encrypted
3. Devices with critical issues
```
```text theme={null}
Add a dropdown filter at the top right to filter by department tag.
Add a search box to filter the device table.
```
```text theme={null}
Use our corporate colours: primary #16A34A, secondary #07C983.
Make the metric cards larger with bold numbers.
```
### What the AI can and can't see
Reporting uses a privacy-by-design model:
The AI sees **schema** — field names and types (`deviceName: string`, `lastOnline: timestamp`)
The AI sees **your prompts** — what you describe wanting
The AI sees **the code it's writing**
The AI does **not** see actual data values — never your device names, user emails, IP addresses, or any field contents. When the app runs in preview, Protect executes the AI-generated code against your data on your side. The AI only sees the structure.
The schema is configurable at [Settings → Schemas](/settings/schemas) — Device Data and User Data have X-Ray views showing exactly what the AI sees.
### Components available
The Reporting component library covers 46 components across 7 categories:
| Category | Components |
| --------------------- | ------------------------------------------------------------------------------------------------ |
| **General** | Text, Heading, Card, Container, Divider, Badge, Avatar |
| **Form** | Input, Textarea, Select, Multi-select, Checkbox, Radio, Date picker, File upload, Slider, Switch |
| **Popups & Overlays** | Modal, Drawer, Popover, Tooltip, Toast |
| **Navigation** | Tabs, Stepper, Breadcrumb, Pagination, Menu |
| **Layout** | Grid, Stack, Spacer, Divider, Accordion |
| **Charts & Graphs** | Line, Bar, Donut/Pie, Area, Scatter, Sparkline, Gauge, Heatmap |
| **Tables & Data** | Table, Data Grid, KPI Card, Stat, Metric |
### Publishing and pinning
When you publish an app:
| Visibility | Who sees it |
| ------------ | -------------------------------------- |
| **Private** | Only you (drafts, personal dashboards) |
| **Team** | One or more selected teams |
| **Everyone** | All Protect users with access |
After publishing, click **Pin to Sidebar** on the app to add it to the Protect left rail. Pinned apps become first-class navigation alongside Devices, Issues, and the Action Center.
### PDF generation
Most apps support **Generate PDF** from the app's 3-dot menu:
* A4 / A3 paper size
* Portrait / landscape orientation
* One-shot now, or schedule recurring (where available)
Use this for board-deck appendices, audit submissions, and MSP client deliverables.
### Editing safely
Edits stay in Build mode until you Publish. The Published version stays live until promoted.
If you make a mistake, restore the last published version. The Composer logs every checkpoint.
For risky redesigns, clone the app first ("App v2"), iterate there, then replace the original when ready.
Add changelog entries in the app's description so future maintainers understand evolution.
### Code ownership
Every app's code is yours:
* The AI writes React + TypeScript code
* You can view it via the source viewer (the `` icon)
* You can download the full package
* You can run it outside Protect in your own React environment
Reporting is a generator that gives you working code, not a black box. If you outgrow conversational editing, take the export and modify it directly.
### Example: weekly executive summary
```text theme={null}
Build me an executive summary dashboard.
Top: title "Weekly Security Summary" with the current date.
Three KPI cards in a row:
1. EDR coverage % across End-User devices
2. MFA enrolment % across all users
3. Critical issues count
Below: a line chart of overall posture % over the last 30 days.
Below that: a table of the top 10 devices by issue count,
columns: Device Name, User, Last Online, Issue Count.
Use my corporate colours: primary #16A34A.
```
The AI builds this in 60-90 seconds. Iterate on layout, colours, copy via follow-up prompts. Publish as Team-visible. Pin to sidebar. Generate weekly PDF via Schedule.
## Common report patterns
**Question**: which devices don't have a required control?
1. In Devices, query: `tags:End-User AND system.crowdstrike.required:true AND system.crowdstrike.deployed:false`
2. Save view as "End-User Devices Missing CrowdStrike"
3. Schedule: Weekly CSV to [security-ops@company.com](mailto:security-ops@company.com), Monday 8am
4. Pair with a [Continuous Action](/automation) on the same query for automated remediation
**Question**: which agents are deployed but not functioning?
1. Query: `(system.crowdstrike.deployed:true AND system.crowdstrike.functioning:false) OR (system.microsoft_defender_atp.deployed:true AND system.microsoft_defender_atp.functioning:false)`
2. Save view as "Broken Security Agents"
3. Schedule: Daily CSV to [soc@company.com](mailto:soc@company.com), weekday mornings
4. Why it works: Protect computes the not-functioning state from cross-tool comparison — the single-tool console cannot
**Question**: what % of devices are fully compliant against our baseline?
1. Build the query that captures *compliant* devices (`tags:End-User AND system.crowdstrike.deployed:true AND system.crowdstrike.functioning:true AND system.microsoft_intune.deployed:true AND ...`)
2. Save view as "End-User Compliant"
3. Build a Reporting app that surfaces the percentage with a gauge + trend
4. Schedule: Reporting PDF export via the app's Generate PDF — Monthly to leadership
**Question**: how is our Win10 → Win11 migration progressing?
1. Create a Snapshot [Action](/automation) capturing the current set of Win10 devices
2. Action card shows N / Total with progress bar
3. For weekly leadership reporting, build a Reporting dashboard that pulls from the same query and adds historical trend
4. Schedule: Weekly XLSX of unresolved devices to [migration-team@company.com](mailto:migration-team@company.com)
**Question**: monthly compliance report for Client Acme
1. Build views filtered by `tags:Acme`
2. Reporting app with company branding (Acme logo, colours) showing key metrics
3. PDF export, scheduled monthly
4. Send via the Reporting app's Schedule feature (where available) or via an outbound automation that pulls the saved view XLSX
## Export formats
| Format | Best for |
| ----------------------- | --------------------------------------------------------- |
| **CSV** | Excel analysis, BI tool import, sharing with stakeholders |
| **JSON** | Programmatic processing, scripts, data warehouse ingest |
| **XLSX** | Direct Excel consumption with formatting preserved |
| **PDF (via Reporting)** | Executive presentations, audit deliverables |
## Audience-tailored cadence
A working rhythm that scales:
| Audience | Cadence | Channel | Format |
| ------------------- | --------- | ------------------ | ----------------------------- |
| SOC analysts | Daily | Email + screen | CSV / Dashboard |
| Department IT leads | Weekly | Email | XLSX |
| CISO / leadership | Monthly | Email + meeting | PDF (Reporting) |
| Board | Quarterly | Meeting + appendix | PDF (Reporting) |
| Auditor | On-demand | Email | XLSX + audit log export |
| MSP client | Monthly | Email | PDF (Reporting with branding) |
## Best practices
Mondays at 8am for operational teams. First-of-the-month for management. Avoid Friday evening (no one reads them).
A daily report to 30 people is a daily delete to 28 people. Right person, right cadence.
In the report description, name the human responsible for the underlying view. When metrics change unexpectedly, recipients know who to ask.
Monthly compliance reports should be saved to a long-retention bucket. The Settings → Scheduled Reports previously-generated list is a convenience, not a compliance archive.
If a report has been alerting on the same 12 devices for three months, the underlying problem isn't visibility — it's that no one is acting. Wire an Action onto the same query.
## Cross-references
The admin page
What the AI can see
Where saved views are built
Pair every report with an action