> ## Documentation Index
> Fetch the complete documentation index at: https://docs.threataware.com/llms.txt
> Use this file to discover all available pages before exploring further.
# Take the In-Product Tour
> Nine screens, two minutes — Protect's built-in onboarding tour
ThreatAware Protect ships with a 9-step in-product tour. New users see it automatically on first visit; everyone can restart it on demand.
## Restart the tour anytime
Top-right of any page, click your initials (e.g. `JT`).
From the dropdown.
The overlay highlights one element per step with a brief explanation. Click **Skip** to dismiss at any point.
**Page-specific tours.** "Help for this page" gives you the tour for the page you're currently on. Restart on Dashboard, Devices, Settings, and Studio for the most comprehensive coverage.
## The Dashboard tour (9 steps)
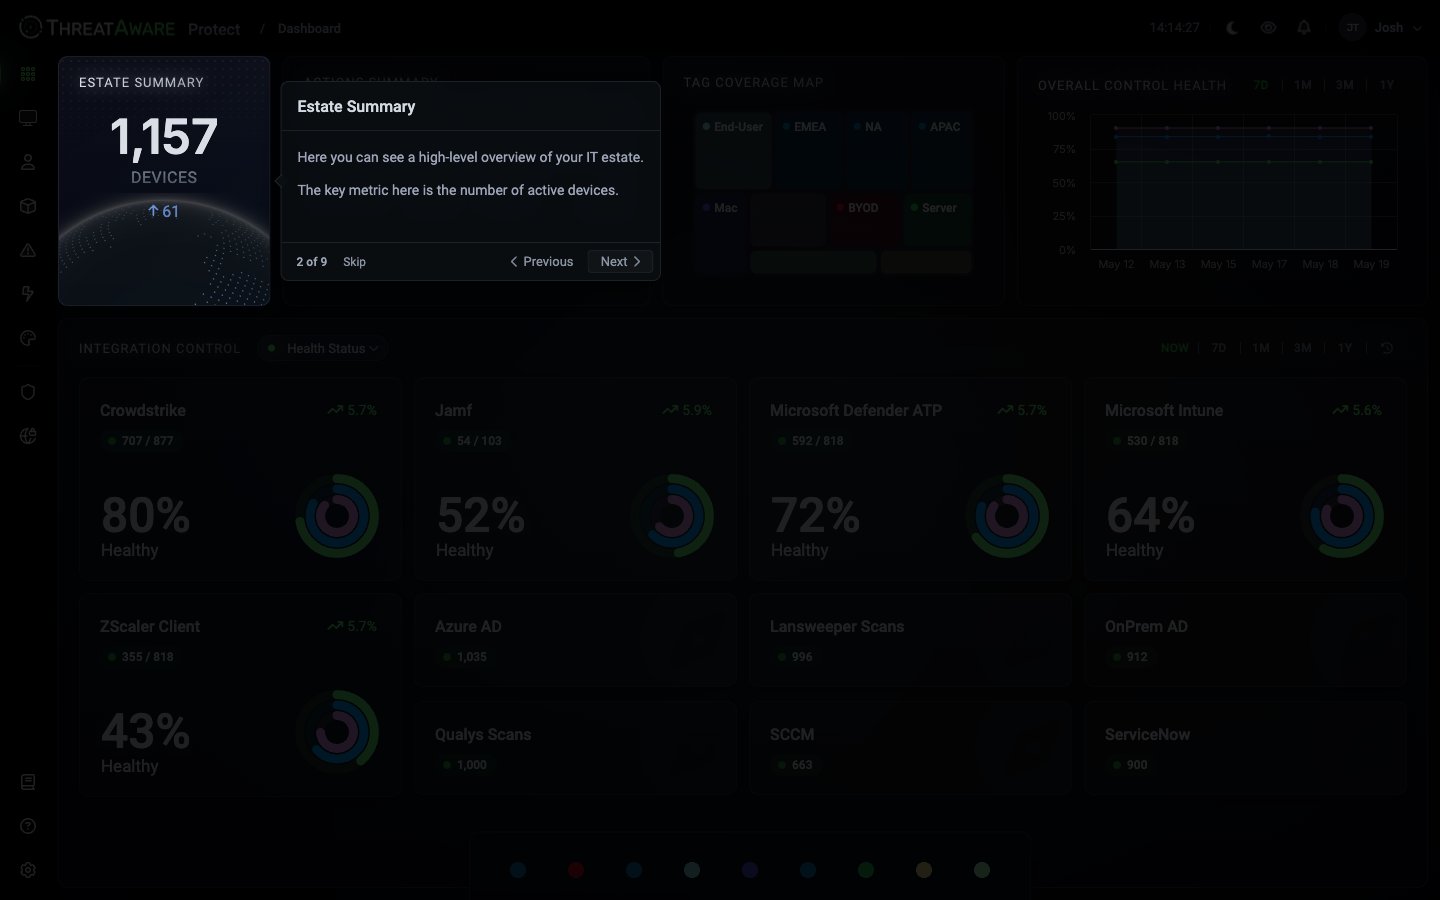 The Dashboard tour walks through every panel. Verbatim copy from the live tour:
| Step | Title | Copy |
| ---- | -------------------------------- | ---------------------------------------------------------------------------------------------------------------------------------------------------------------------------------------------------------------------------------- |
| 1 | Welcome to ThreatAware Dashboard | *"Welcome to your ThreatAware Dashboard! This is your command center for monitoring your security posture. Let's take a quick tour of the key features to get you started."* |
| 2 | Estate Summary | *"Here you can see a high-level overview of your IT estate. The key metric here is the number of active devices."* |
| 3 | Actions & Alerts | *"This panel gives you timely insights into key metrics from Action Center. Review critical figures including total jobs and the success rate."* |
| 4 | Tag Coverage Map | *"The Tag Coverage Map shows how your devices are categorized and tagged. Each color represents a different tag, with size indicating the number of devices. Use tags to organize and filter your devices for better management."* |
| 5 | Control Health Overview | *"The Control Health panel provides insights into your security controls. View control effectiveness, coverage gaps, and how they have changed over time."* |
| 6 | Integration Control Center | *"View the status of all connected integrations across your IT estate. Clicking on an integration will take you to the Device Inventory, with an appropriate filter applied on the systems column."* |
| 7 | Tag Navigation | *"These tag chips at the bottom allow you to filter your dashboard by specific tags. Click any tag to see data filtered to that specific tag."* |
| 8 | Tutorial Controls | *"You can restart this tutorial anytime by clicking this button in the user dropdown menu. Perfect for onboarding new team members or refreshing your knowledge."* |
| 9 | Tutorial Complete! 🎉 | *"Congratulations! You've completed the dashboard tour. Next, I recommend you head over to the Devices page to see how you can manage your devices."* |
After completing the Dashboard tour, follow the platform's recommendation and open the **Devices** page for the next tour.
## Why restart the tour?
Walk a new analyst through the dashboard in two minutes — the tour points at every panel.
When the version chip on Device Explorer ticks up, restart the tour to surface any new highlighted features.
Forgotten what a panel does? Restart the tour rather than digging into docs.
The tour gives a consistent narrative — easier than ad-lib for first-time viewers.
## Pair the tour with these doc pages
After running the tour, the natural follow-ups:
Full anatomy of the chrome and data flow
Connect your first integrations
Your first 24 hours
The Dashboard tour walks through every panel. Verbatim copy from the live tour:
| Step | Title | Copy |
| ---- | -------------------------------- | ---------------------------------------------------------------------------------------------------------------------------------------------------------------------------------------------------------------------------------- |
| 1 | Welcome to ThreatAware Dashboard | *"Welcome to your ThreatAware Dashboard! This is your command center for monitoring your security posture. Let's take a quick tour of the key features to get you started."* |
| 2 | Estate Summary | *"Here you can see a high-level overview of your IT estate. The key metric here is the number of active devices."* |
| 3 | Actions & Alerts | *"This panel gives you timely insights into key metrics from Action Center. Review critical figures including total jobs and the success rate."* |
| 4 | Tag Coverage Map | *"The Tag Coverage Map shows how your devices are categorized and tagged. Each color represents a different tag, with size indicating the number of devices. Use tags to organize and filter your devices for better management."* |
| 5 | Control Health Overview | *"The Control Health panel provides insights into your security controls. View control effectiveness, coverage gaps, and how they have changed over time."* |
| 6 | Integration Control Center | *"View the status of all connected integrations across your IT estate. Clicking on an integration will take you to the Device Inventory, with an appropriate filter applied on the systems column."* |
| 7 | Tag Navigation | *"These tag chips at the bottom allow you to filter your dashboard by specific tags. Click any tag to see data filtered to that specific tag."* |
| 8 | Tutorial Controls | *"You can restart this tutorial anytime by clicking this button in the user dropdown menu. Perfect for onboarding new team members or refreshing your knowledge."* |
| 9 | Tutorial Complete! 🎉 | *"Congratulations! You've completed the dashboard tour. Next, I recommend you head over to the Devices page to see how you can manage your devices."* |
After completing the Dashboard tour, follow the platform's recommendation and open the **Devices** page for the next tour.
## Why restart the tour?
Walk a new analyst through the dashboard in two minutes — the tour points at every panel.
When the version chip on Device Explorer ticks up, restart the tour to surface any new highlighted features.
Forgotten what a panel does? Restart the tour rather than digging into docs.
The tour gives a consistent narrative — easier than ad-lib for first-time viewers.
## Pair the tour with these doc pages
After running the tour, the natural follow-ups:
Full anatomy of the chrome and data flow
Connect your first integrations
Your first 24 hours