

Overview
The Devices page at/devices is the workhorse of Protect. It’s a single inventory of every device across your environment, fused from every connected source. Where Device Explorer shows the world map, Devices is the data grid.
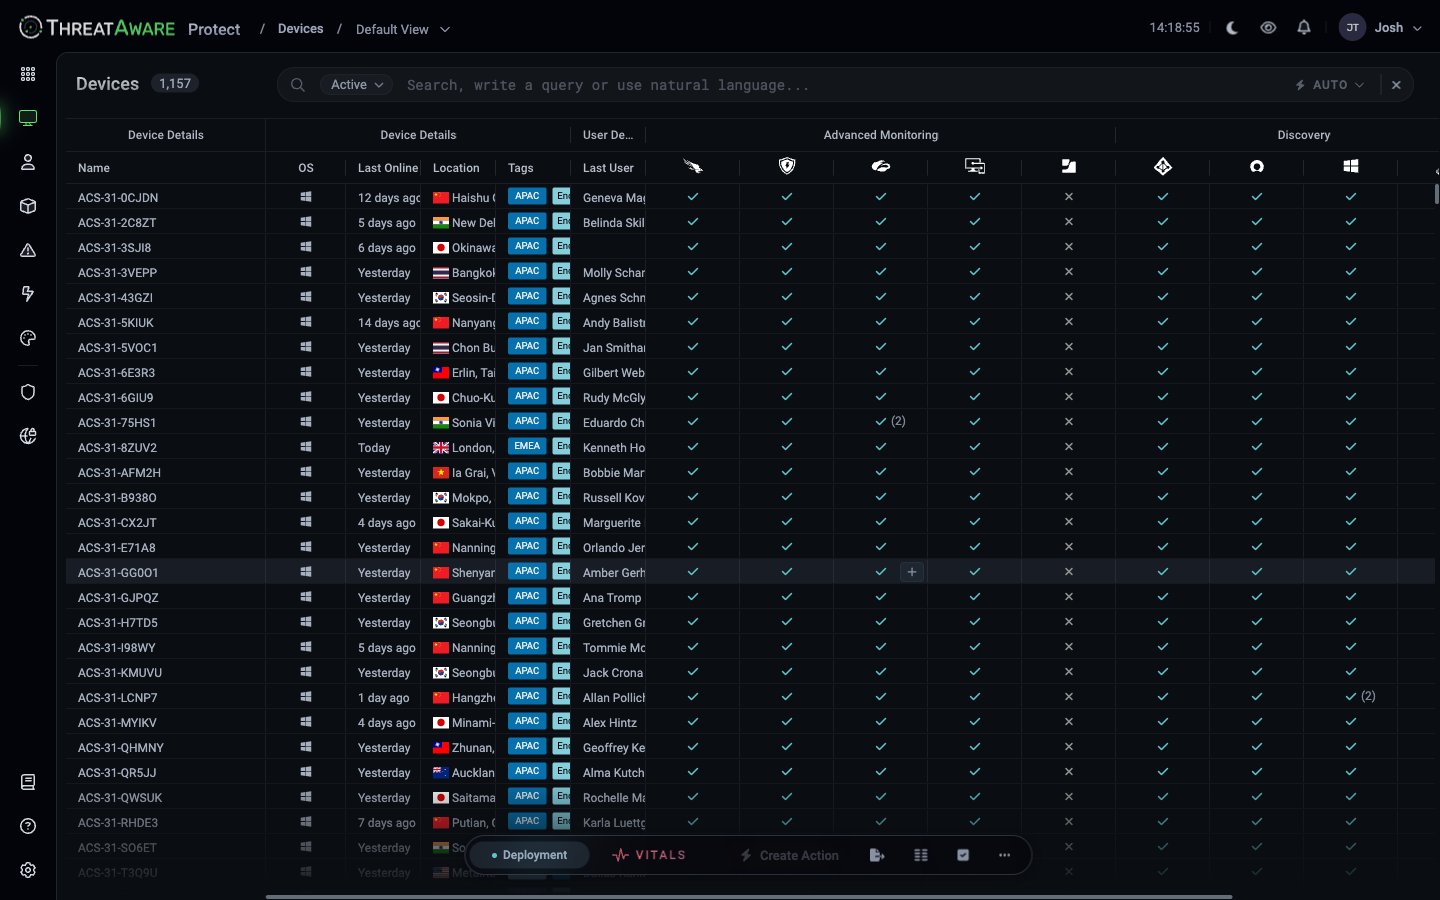
Column architecture
Columns are organised into five groups:
In Deployment view each integration column is a check / no-check (“does this device exist in this tool?”). In Vitals view the same column shows Healthy / Functioning / Misconfigured / Not Healthy. Toggle in the bottom-left of the page footer.
Default vs custom columns
The default column set is intentionally minimal — Name, OS, Last Online, Location, Tags, Last User, plus the integration columns. Hundreds of additional fields are available via the column editor (grid icon, bottom-right of the page):Hardware
Hardware
metadata.serial_number, metadata.manufacturer, metadata.model, metadata.cpu_model, metadata.cpu_cores, metadata.cpu_speed, metadata.total_ram, metadata.total_storage, metadata.free_storage, metadata.architecture, metadata.disk_type, metadata.video_card, metadata.warranty_expiryNetwork
Network
privateIp, publicIp, macAddress, metadata.domain, location.country, location.city, location.countryCode, location.coordinatesUser & Identity
User & Identity
lastUser.email, lastUser.name, lastUser.department, lastUser.jobTitleOS & Lifecycle
OS & Lifecycle
os (enum: Windows / MacOs / Linux), osVersion, metadata.os_build, lastLogin, lastOnlineSecurity state (per-integration)
Security state (per-integration)
system.<integration>.required, system.<integration>.deployed, system.<integration>.functioning, system.<integration>.configuredCorrectly (booleans, one set per connected integration — see Reference → Vitals states)The device detail panel
Click any row to open the device detail panel on the right.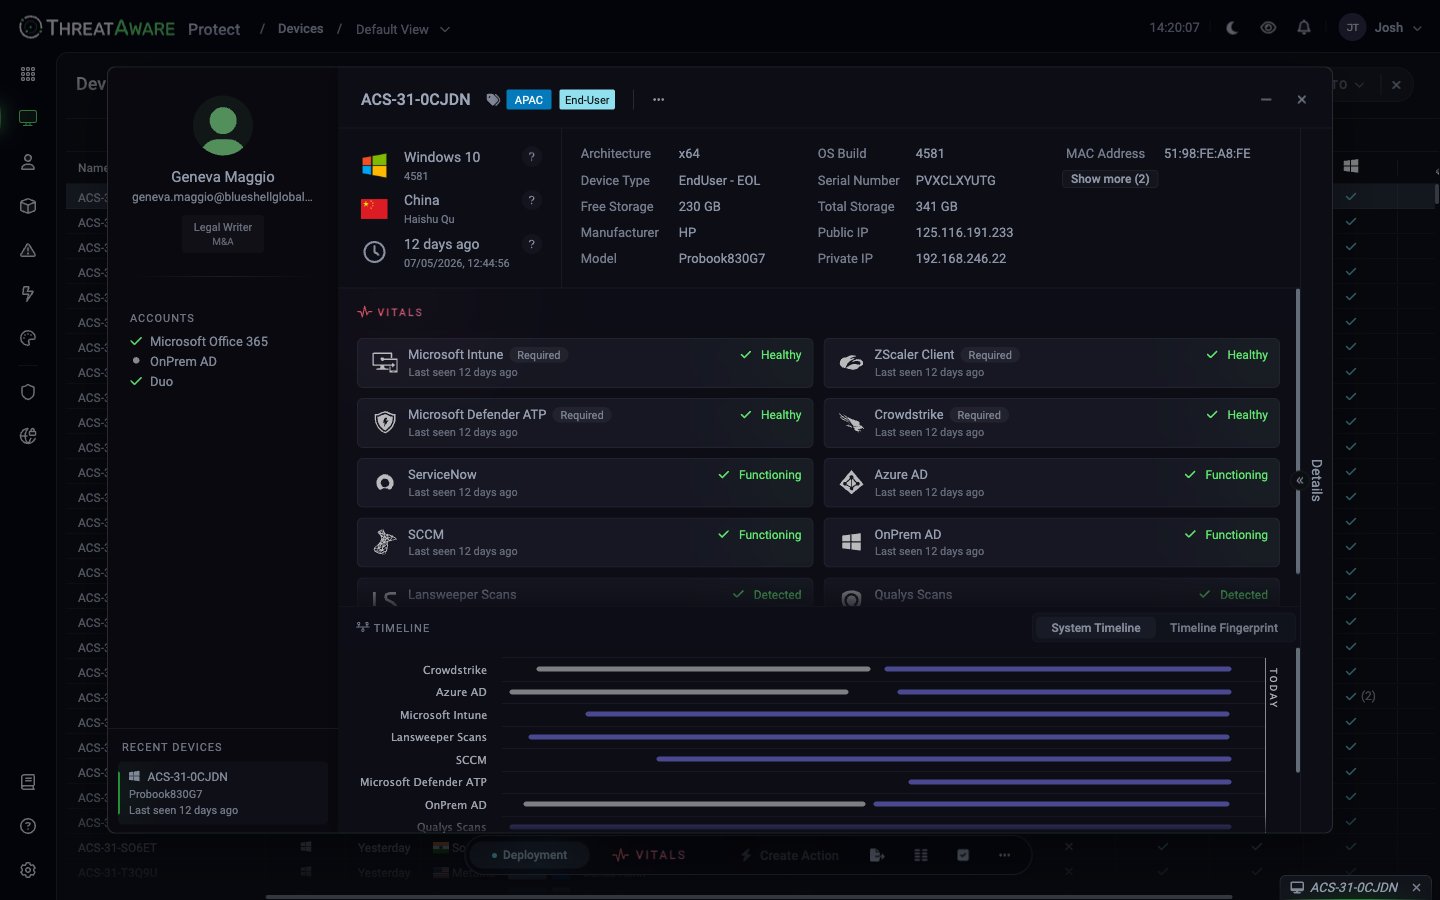
Top tab strip
The detail panel preserves a tab strip — opening another device adds a new tab. This lets you compare devices side-by-side without losing context. Close tabs with the × on each.Left sidebar — user card
Shows the device’s primary user:- Avatar + name + email + role
- Accounts: which identity sources show this user (Microsoft 365, OnPrem AD, Duo, etc.)
- Recent Devices: other devices this user has signed into recently
Main area
- Device header: name, OS (icon + version + build), Architecture, MAC, Serial, Manufacturer, Model, Domain
- Issues button: jumps to Issues filtered to this device
- Vitals tiles: a tile per integration with Required tag and current state (Healthy / Functioning / Misconfigured)
- Activity Timeline: per-integration last-seen bars over time — visual proof of which tools have been talking to this device when
- Tags: every tag the Logic Engine has applied
Bottom action bar
- Deployment / Vitals toggle (same as the grid)
- Create Action (active when one or more devices are selected in the grid)
- Quick actions: export this device, copy link, refresh, additional actions
Active vs Inactive devices
Protect distinguishes Active from Inactive devices by the Inactive device threshold in Settings → Misc (default30 days).
The Devices grid defaults to Active. The Active ▾ pill at the left of the search bar switches between Active (“Devices that are currently active”) and Inactive (“Devices that are currently inactive”). It is a UI toggle — there is no
state field in the query language.
Deduplication & matching
A single physical device often reports from 5+ tools. Protect uses a patented timeline-matching algorithm with these signals (in order of reliability):
A single device record is created once, with all source data attached. Hover the integration columns to see which tools each device reports from — or open X-Ray for the full breakdown.
Edge cases
VMs with duplicate serial numbers
VMs with duplicate serial numbers
Common in cloned environments. Matching falls through to hostname + IP + timeline, with the source-tool device-id as a final tiebreaker.
Reused machine names
Reused machine names
Same name on a new physical machine. Serial number plus First Seen date distinguishes them; the previous device falls into Inactive after the threshold.
Device records that look duplicated
Device records that look duplicated
If you see two rows that should be one, open X-Ray on each — if there’s no shared field, they really are different devices and matching is correct. If there’s an overlap (same serial in different tools), open a support ticket.
Search, filter, save
The search bar accepts:- Free text against
Name(ACS-31-) - The full query language (
os:Windows AND tags:End-User) - Natural language in AI-enabled tenants
- Save View — bottom-left of the grid
- Name it
- Visibility: Private / Team / Everyone
- Saved views appear in the Default View dropdown (top-right)
From inventory to action
The flow:- Build a query in Devices.
- Save the View — or schedule a recurring CSV / JSON / XLSX export from the saved view.
- Select rows + Create Action — choose Continuous (always-on) or Snapshot (fixed scope), then pick the channel(s): email, ticket, webhook, Teams, or Power Automate.
Export
All grids can export:- CSV — current columns, current filter, current sort
- JSON — full structured record for each row including nested integration data
- XLSX — formatted Excel
Tips
Cross-references
Query Language
The full search syntax
X-Ray
Raw data per device
Vitals Configuration
Define what controls are required
Action Center
Turn filtered views into automation
Tags & Logic Engine
Automatic device categorisation
Scheduled Reports
Recurring CSV/JSON/XLSX delivery