

Tier: Basic exports (CSV / JSON / XLSX) and saved views are available across all tiers. The AI Advanced Reporting app builder is included in the Protect tier. The Control Health Dashboard ships with Discover and Protect.
The three reporting surfaces
Protect offers three layered approaches to reporting:
Pick the surface that matches the audience: leadership wants Reporting dashboards and scheduled PDF; the security ops team wants the Dashboard left open on a screen; auditors want scheduled XLSX deliveries.
Dashboard
Platform Overview → Dashboard covers the layout. Use it for:- Daily standup background — leave the Overall Control Health trend visible
- NOC / SOC big-screen — Integration Control panel as a wall display
- Leadership walkthroughs — Estate Summary + Actions Summary tells the story without a slide
Scheduled Reports
Settings → Scheduled Reports is where you set up recurring email deliveries.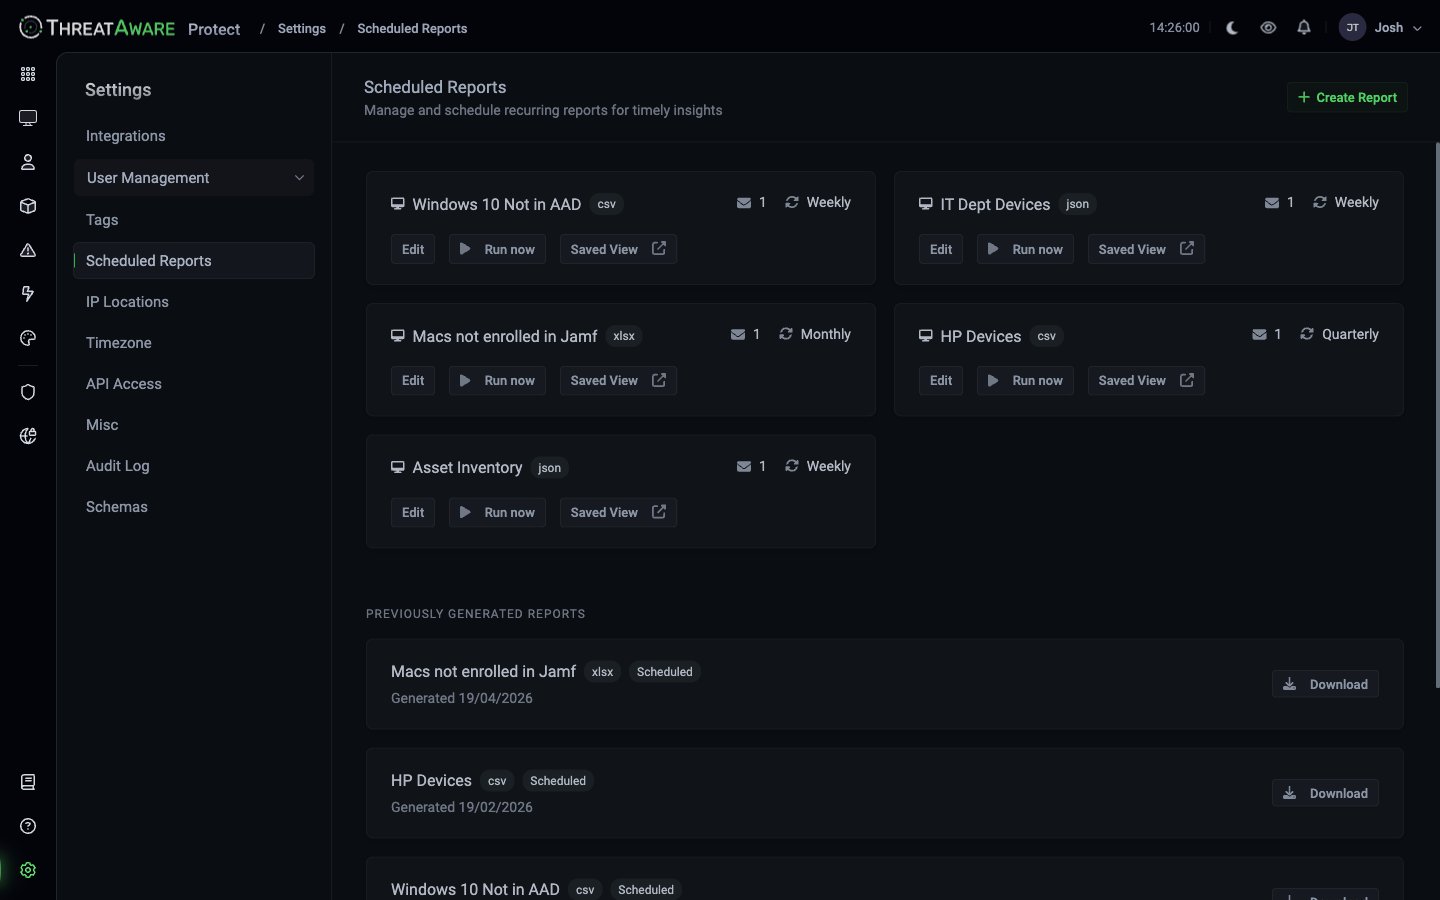
How it works
Every scheduled report references a Saved View (built in Devices, Users, Software, or Issues). At each scheduled time, the report exports the current contents of that view and emails the file.Example schedules
Previously generated reports
Below the live schedules, PREVIOUSLY GENERATED REPORTS shows every past delivery with a Download button. Useful when:- Recipient lost the email
- An auditor wants a specific historic snapshot
- You need to compare period-over-period
Limitations
Reporting (AI-powered apps)
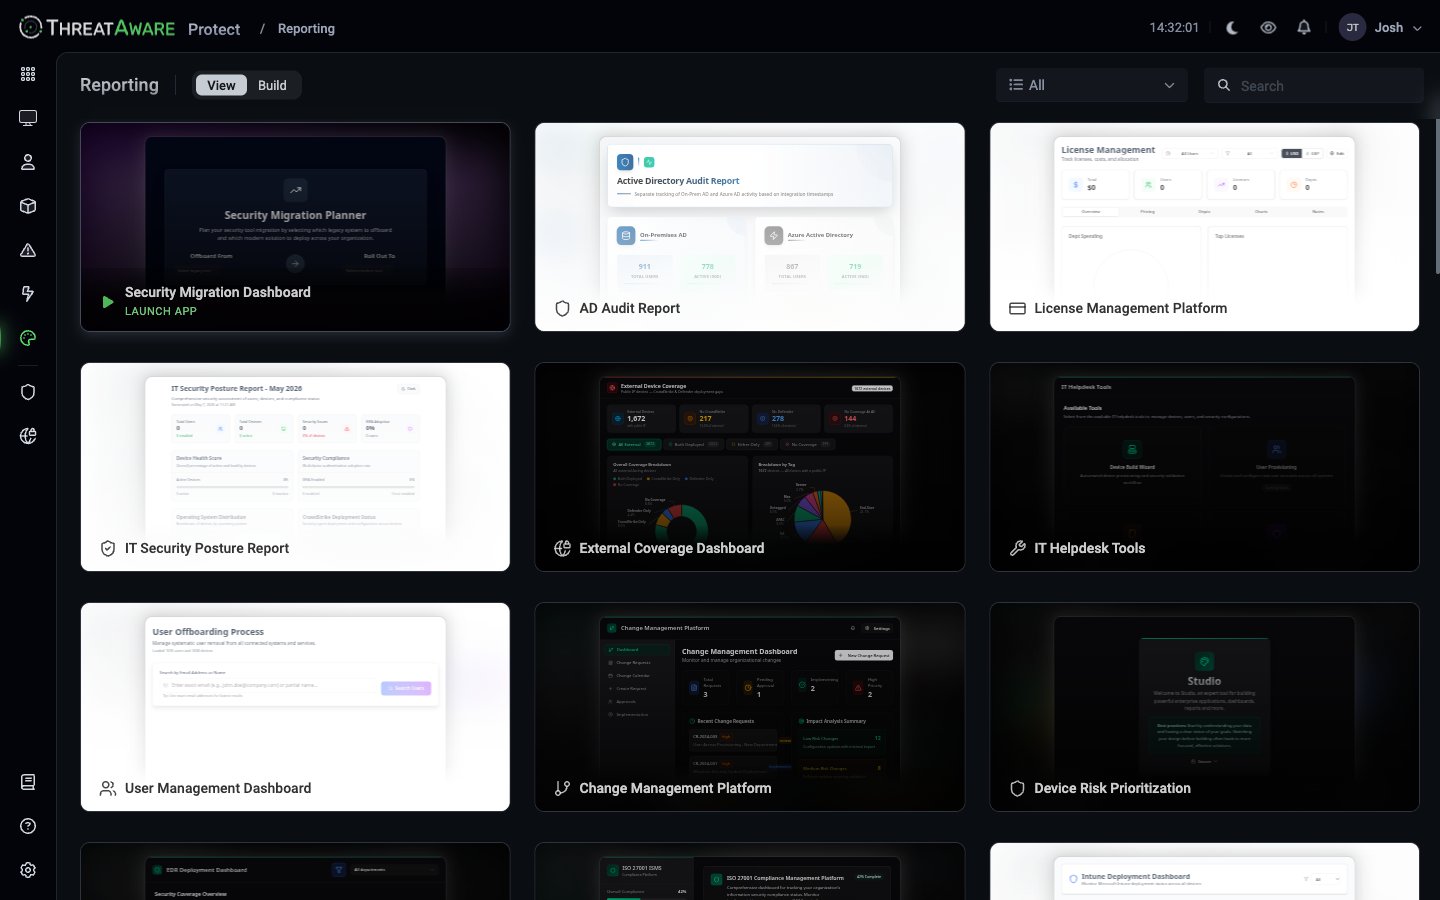
Reporting is the deepest layer — natural-language-built custom dashboards and tools, accessed from the left rail (palette icon,/studio/editor). The Composer reads directly from Protect’s device, user, and software schemas. Use it when:
- The Dashboard doesn’t show what you need
- Scheduled CSV/JSON isn’t interactive enough
- You want stakeholders to consume reports in-product, not via email
- You need PDF generation with custom branding
- You want to build internal tools beyond reporting (wizards, validation forms, lifecycle tools)
The editor
The Reporting editor has two main panels:Build mode vs. View mode
Top tabs:- View — see published apps (the gallery)
- Build — see apps in edit mode + start new ones from templates
- Edit an existing app via the 3-dot menu → Edit
- Start from a template (Blank Canvas, Default, Dashboard Manager)
- Click
+ Newto start from scratch
What’s shipped out of the box
Pre-built apps available out of the box:
These are starting points — clone any of them via the 3-dot menu → Clone to begin a customised version.
Building with natural language
The Composer accepts conversational prompts. Build incrementally — one change per prompt.- Start with structure
- Add visualisation
- Add KPIs
- Add interactivity
- Refine styling
What the AI can and can’t see
Reporting uses a privacy-by-design model:The AI sees schema — field names and types (
deviceName: string, lastOnline: timestamp)The AI sees your prompts — what you describe wanting
The AI sees the code it’s writing
Components available
The Reporting component library covers 46 components across 7 categories:Publishing and pinning
When you publish an app:
After publishing, click Pin to Sidebar on the app to add it to the Protect left rail. Pinned apps become first-class navigation alongside Devices, Issues, and the Action Center.
PDF generation
Most apps support Generate PDF from the app’s 3-dot menu:- A4 / A3 paper size
- Portrait / landscape orientation
- One-shot now, or schedule recurring (where available)
Editing safely
Test in Build mode, publish when ready
Test in Build mode, publish when ready
Edits stay in Build mode until you Publish. The Published version stays live until promoted.
Use Restore Checkpoint
Use Restore Checkpoint
If you make a mistake, restore the last published version. The Composer logs every checkpoint.
Duplicate before major changes
Duplicate before major changes
For risky redesigns, clone the app first (“App v2”), iterate there, then replace the original when ready.
Document changes in description
Document changes in description
Add changelog entries in the app’s description so future maintainers understand evolution.
Code ownership
Every app’s code is yours:- The AI writes React + TypeScript code
- You can view it via the source viewer (the
</>icon) - You can download the full package
- You can run it outside Protect in your own React environment
Example: weekly executive summary
Common report patterns
- Coverage gap
- Broken agents
- Compliance scorecard
- OS migration tracker
- MSP client deliverable
Question: which devices don’t have a required control?
- In Devices, query:
tags:End-User AND system.crowdstrike.required:true AND system.crowdstrike.deployed:false - Save view as “End-User Devices Missing CrowdStrike”
- Schedule: Weekly CSV to security-ops@company.com, Monday 8am
- Pair with a Continuous Action on the same query for automated remediation
Export formats
Audience-tailored cadence
A working rhythm that scales:Best practices
Schedule at useful times
Schedule at useful times
Mondays at 8am for operational teams. First-of-the-month for management. Avoid Friday evening (no one reads them).
Keep recipient lists tight
Keep recipient lists tight
A daily report to 30 people is a daily delete to 28 people. Right person, right cadence.
Document the report owner
Document the report owner
In the report description, name the human responsible for the underlying view. When metrics change unexpectedly, recipients know who to ask.
Archive auditor-relevant reports
Archive auditor-relevant reports
Monthly compliance reports should be saved to a long-retention bucket. The Settings → Scheduled Reports previously-generated list is a convenience, not a compliance archive.
Pair every scheduled report with an Action
Pair every scheduled report with an Action
If a report has been alerting on the same 12 devices for three months, the underlying problem isn’t visibility — it’s that no one is acting. Wire an Action onto the same query.
Cross-references
Settings → Scheduled Reports
The admin page
Settings → Schemas
What the AI can see
Devices
Where saved views are built
Action Center
Pair every report with an action