

The product surface
ThreatAware Protect is a single web application athttps://<your-cloud-id>.threataware.com. The chrome is consistent across every page.
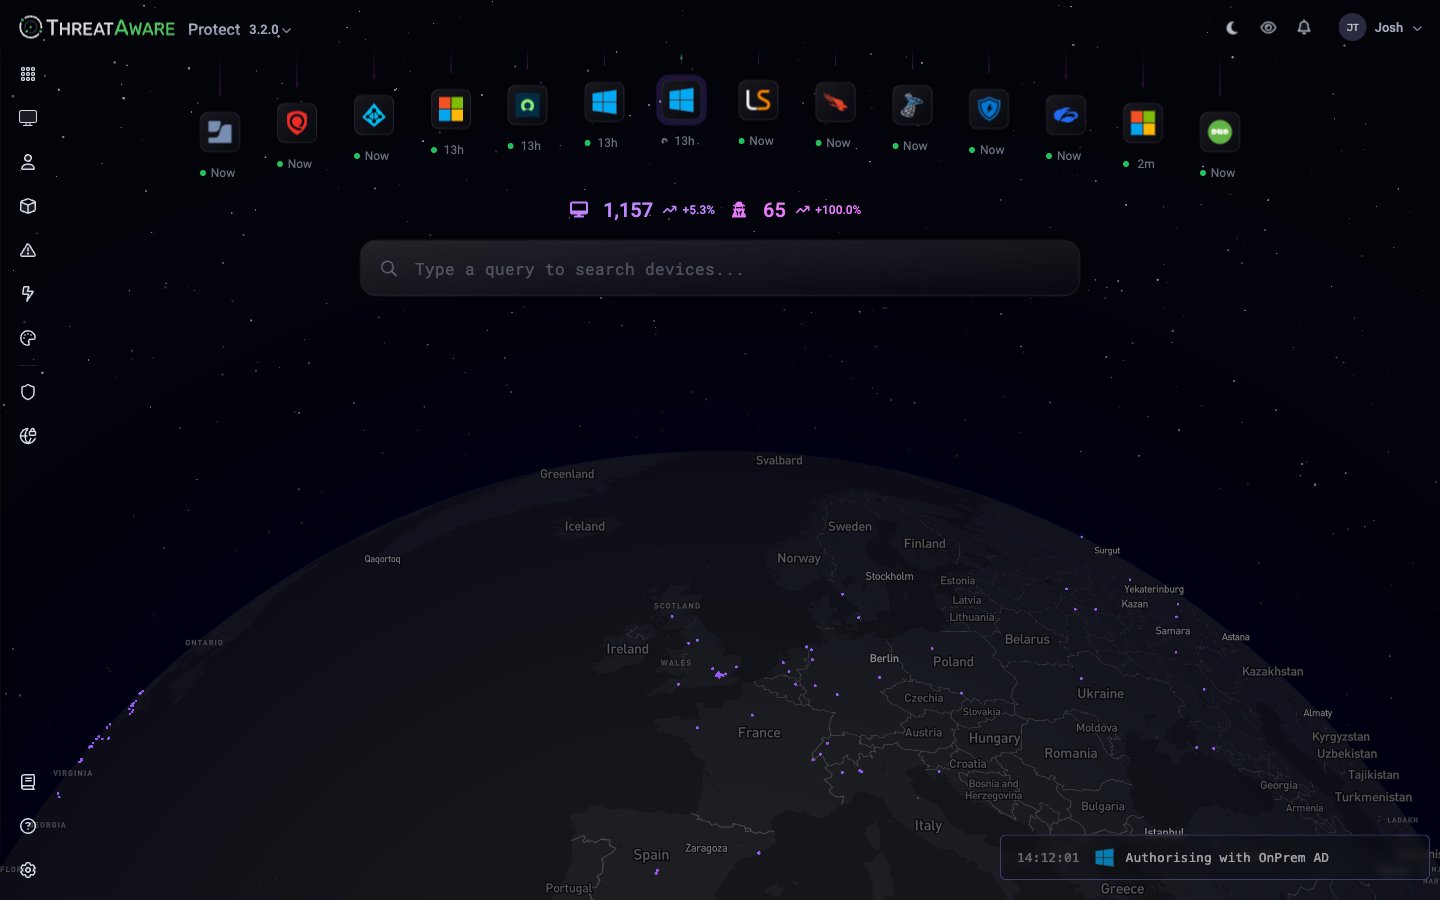
Top bar
- Logo + product name:
ThreatAware Protect. On the Device Explorer page the version (e.g.3.2.0) is appended; on other pages onlyProtectis shown. The clock, theme toggle, visibility eye, notifications bell, and user menu sit to the right. - Breadcrumb: e.g.
/ Settings / Tags— click any segment to jump back up. - Date / time in your locale (configurable in Settings → Timezone).
- Theme toggle — switch between dark (default) and light.
- Visibility toggle — show/hide sensitive fields (helpful when screen-sharing).
- Notifications — bell icon with badge.
- User menu — initials + first name. Reveals:
- Your name, tenant role, email, team chips
- Sandbox Controls (in sandbox tenants)
- Help for this page (restarts the in-product tour)
- About • Install Browser Extension ↗ • Log Out
Left rail
Seven primary destinations (top section), then pinned Studio apps (middle), then Settings (bottom):
The Device Explorer at
/device-explorer is the default landing route after Single Sign-On (SSO) and can be re-set in Settings → Misc. The Network Inventory at /network-device-inventory is reachable from links on Device Explorer / Dashboard but isn’t a primary left-rail destination.
Core architecture
ThreatAware Protect uses a patented timeline-matching algorithm to discover and track devices:1
Collection
Protect polls every connected tool via API on a schedule (typically every hour). On-prem tools without cloud APIs are reached via the PowerShell Relay.
2
Normalization
Each tool’s data is mapped into a canonical schema —
hostName, metadata.serial_number, lastOnline, macAddress, and so on. See Reference → Query Syntax for the full field list.3
Matching & deduplication
A single physical device may report from CrowdStrike, Intune, Active Directory, and Lansweeper. The matching algorithm uses serial number, machine name, MAC address, user association, and timeline correlation to fuse those reports into one device record.
4
Enrichment & vitals
The unified record is enriched with derived fields (location from IP geolocation, tags from rules) and evaluated against your Vitals configuration.
Data flow
Dashboard
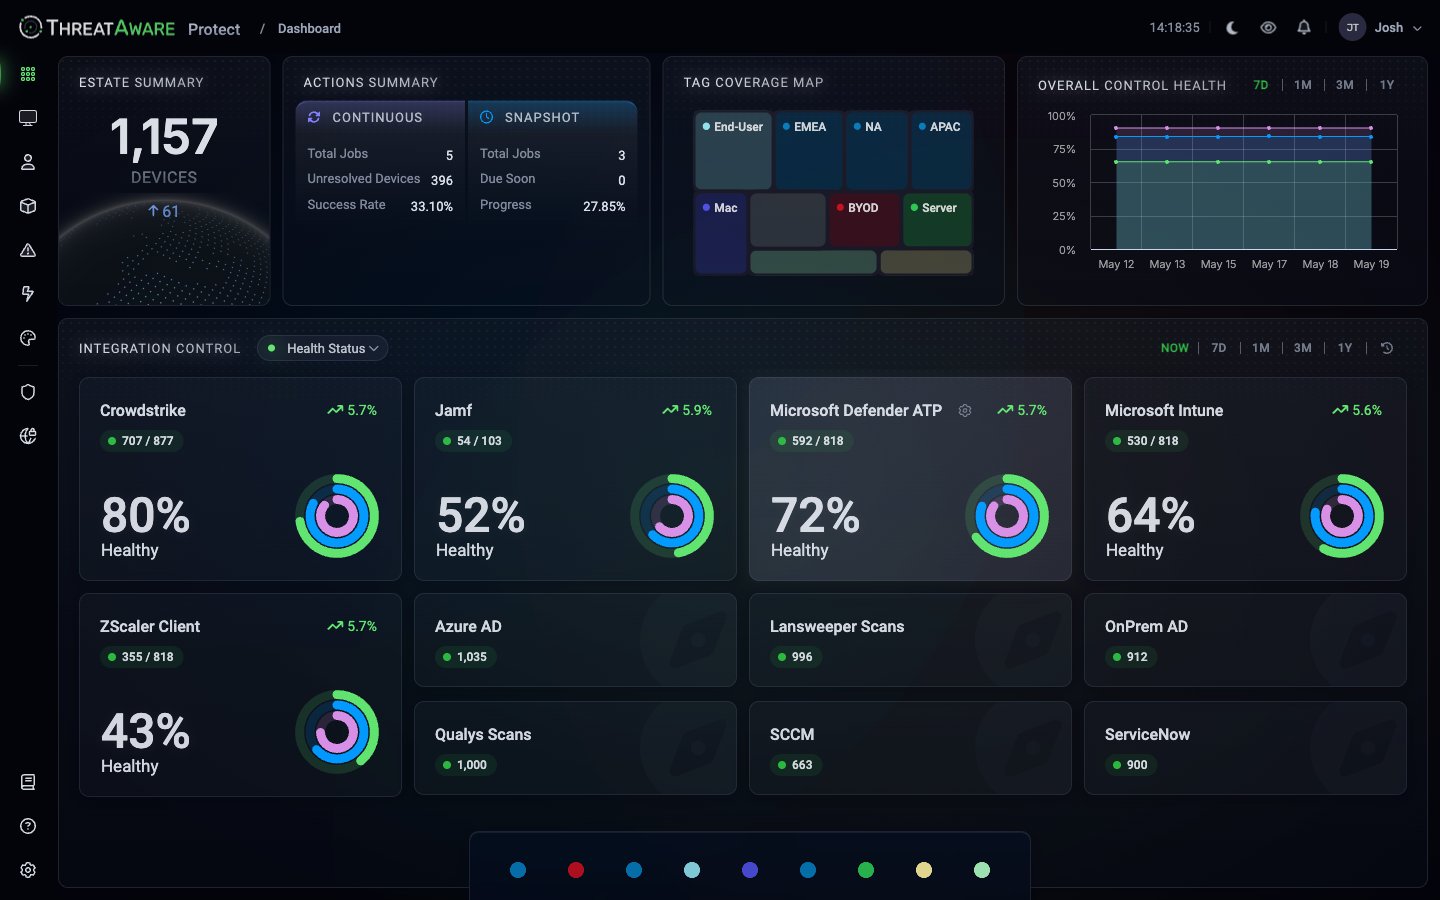
Clicking any Integration Control card takes you to Devices filtered to that integration’s slice of the estate.
The tag chips strip along the bottom (
APAC, BYOD, EMEA, End-User, Mac, NA, Server, Stock, VM …) filters the entire dashboard to devices carrying that tag.
Equal-treatment philosophy
ThreatAware treats every integration equally. No tool is designated “primary” or “source of truth”.- A device discovered in any connected source appears in Protect
- The matching algorithm fuses cross-tool data into one record
- Discrepancies become visible — that’s the whole point
Three-stage Vitals
Traditional monitoring stops at “Is the agent deployed?” Vitals goes further:1. Deployment
Is the security control present on this device? Cross-tool comparison — if AD shows a workstation but CrowdStrike doesn’t, that’s a deployment gap.
2. Function
Is the control actively working and reporting? Device online in Intune in the last 24 hours but CrowdStrike hasn’t seen it for 7+ days = agent broken, not offline.
3. Configuration
Is the control configured per policy? Real-time protection enabled? Prevention mode active? Tamper protection on?
X-Ray transparency
Every device drill-down has an X-Ray tab that shows the raw, unmodified data from every connected integration that reported on that device. Last-sync timestamp per integration. Field-by-field comparison. This is your forensics tool when:- A device looks healthy but isn’t
- Two tools disagree about a field
- An auditor asks “prove this data”
- You’re configuring a new integration and want to validate the schema
Security & privacy by default
Read-only API credentials — Protect itself is read-only. Actions can trigger outbound automations with your approval.
Encrypted in transit (TLS 1.2+) and at rest (AES-256)
ISO 27001 certified, Cyber Essentials certified, GDPR compliant
UK data residency by default; other regions on request
No agents to deploy or patch on endpoints
Where to next?
Onboarding
Connect your first integrations
Getting Started
Your first 24 hours
Glossary
Every term Protect uses, defined
Device Management
Master the inventory and query language
Security Monitoring
Configure Vitals
Automation
Build your first Action